By Doug Dawson, July 5, 2023 | Original POTs and PANs article here
Ajit Pai recently wrote an article in the National Review where he talks about how his decision as head of the FCC to repeal net neutrality was the right one. He goes on to claim that repealing net neutrality was the driver behind the current boom in building fiber and upgrading other broadband technologies. He contrasts the progress of broadband in the U.S. with Europe and says that the FCC’s action is the primary reason we are seeing a fiber boom in the U.S.
He points out that his opponents who wanted to keep net neutrality made all sorts of crazy claims about how killing net neutrality would mean killing most of what people like about the Internet. He’s right that the arguments for keeping net neutrality got wrapped into politics, and most of the predicted consequences of ending net neutrality were exaggerated by those in favor of net neutrality. But the claims of the benefits for killing net neutrality were also badly exaggerated by the big carriers.
Why is he writing this now? With the possibility of seating a fifth Commissioner, he knows that the issue of reinstating net neutrality and Title II authority is going to be raised at the FCC. Killing net neutrality was his crowning achievement at the FCC, and he’s defending it as a way to lobby against bringing back net neutrality. I think we’re going to see a lot of this kind of rhetoric this year about how repealing net neutrality was the right thing to do. The big ISPs will be repeating the same rhetoric being told by Pai.
But Pai is not telling the real story. Industry insiders and experts didn’t expect much change to come from repealing net neutrality. The CEOS of all of the big cable companies admitted that keeping or killing net neutrality would have almost no impact on their businesses.
The real purpose of killing net neutrality was to kill Title II authority over broadband. That is an esoteric policy wonk issue and rarely got discussed during the debate. The Ajit Pai FCC gave up all rights of the agency to regulate broadband except for a few rules that are mandated by Congress. While there was a huge noise on both sides of the argument about killing net neutrality, the big ISPs only cared about killing regulation. That was the number one agenda item for Ajit Pai, and he handed the big ISPs everything on their wish list. If you want to understand the net neutrality issue from the big ISP perspective, substitute the word regulation for net neutrality every time they talk about the topic.
Pai cannot say with a straight face that there have been no repercussions about the end of broadband regulation. Consider Comcast and Charter, the two largest ISPs that together have over half of the broadband market. Since the end of Title II regulation, Comcast has raised rates for basic broadband to around $100, Charter is over $90 and is in the process of catching up to the Comcast rates.
At the same time, the FCC dropped all semblance of representing the public. The FCC complaint process for broadband customers might as well not even exist since nothing happens when a customer complains about mistreatment by an ISP.
Pai is taking credit for the boom in broadband competition. I’ve been advising ISPs on their expansion plans for decades, both before and after the death of Title II regulation, and I’ve never heard an ISP consider regulation as part of any discussion of expanding to a new market. Perhaps Pai can take credit for making it easier for others to compete against big cable companies since they have been free to raise rates at will – but I don’t think that’s something he wants to claim out loud. The real impetus for broadband competition came from the pandemic when many millions of customers found out that their broadband was inadequate. That experience has convinced people that they need fiber broadband and faster speeds, and fiber-optic broadband competitors are reacting to that market demand. The cable companies are also rushing to upgrade speeds in response to the pressure from fiber-optic competition.
None of the fiber boom is due to killing regulation. All that killing regulation did was allow big ISPs to run roughshod over customers without consequences. The FCC can’t even pull ISPs in to talk about their bad broadband behavior.
Ajit Pai’s accomplishment was not killing net neutrality – it was handing the reins of the broadband business to the big ISPs by allowing the ultimate regulatory capture of having the FCC walk away from its regulatory responsibilities.
I’m sure that Pai is quite happy with that outcome, but you’ll never see Pai talking about what really happened.
By Doug Dawson June 27, 2023 | Original POTs and PANs article here
I wrote a recent blog that talked about a recent trend where over 81% of U.S. households are now subscribed to a broadband speed of at least 200 Mbps. I got a lot of comments about that post, mostly from ISPs who think that we are fixated too much on speed and that consumers don’t need faster speeds – they think that the marketing departments of the big ISPs have just convinced folks that faster speeds are important.
But when talking about rural versus urban broadband speeds, the discussion can’t only be about what people need or don’t need. There was an edict from Congress in the 1996 Telecommunications Act (1996-TCA) of that directed the FCC to have parity between urban and rural broadband. There has been no change of law that has softened this mandate, so it’s still something that the FCC must do:
U.S. Code Title 47 § 254.(b) Universal Service Principles. —
The Joint Board and the Commission shall base policies for the preservation and advancement of universal service on the following principles:
(1) Quality and Rates — Quality services should be available at just, reasonable, and affordable rates.
(2) Access to Advanced Services — Access to advanced telecommunications and information services should be provided in all regions of the Nation.
(3) Access in Rural and High Cost Areas — Consumers in all regions of the Nation, including low-income consumers and those in rural, insular, and high cost areas, should have access to telecommunications and information services, including interexchange services and advanced telecommunications and information services, that are reasonably comparable to those services provided in urban areas and that are available at rates that are reasonably comparable to rates charged for similar services in urban areas.
The FCC has repeatedly ignored this edict. Probably the most extreme example is when they gave over $11 billion to the biggest telephone companies with CAF II to supposedly upgrade DSL to 10/1 Mbps. This was done at a time when cable companies had mostly upgraded to DOCSIS 3.0, and most urban areas had access to speeds between 100 Mbps and 250 Mbps. By the time the CAF II subsidy ended, cable companies had mostly upgraded to DOCSIS 3.1, and urban speed capabilities in most places had reached 1 gigabit.
If anything surpasses the absurdity of CAF II, it’s the national definition of broadband that still sits at a ridiculous speed of 25/3 Mbps. According to the OpenVault latest statistics, only 4.7% of households with broadband are subscribed to speeds under 50 Mbps. That number doesn’t include rural households who can’t buy broadband because there is no reasonable option where they live – but still, the number of households that are using slow speeds has gotten to be a small fraction of broadband users.
Over the last two years, FCC Chairperson Jessica Rosenworcel suggested that the definition of broadband should be updated to 100 Mbps download. The OpenVault statistics now put that speed in the rearview window. Any federal definition of broadband has to be at least 200 Mbps. I don’t need to put forth any elegant argument why this is so – the statistics make the point for me. Over 80% of U.S. households are now subscribed to speeds of at least 200 Mbps download. The language in the 1996 Act makes it clear that rural residents ought to have access to broadband that is reasonably comparable to the speeds offered in urban areas. Any interpretation of the phrase “reasonably comparable” would conclude that rural speeds ought to at least be at the low end of subscribed urban broadband speeds – 200 Mbps is the minimum speed for over 80% of households.
The fact that over 80% of households are already subscribed to 200 Mbps speeds or faster (40% of households are subscribed to speeds of 500 Mbps or faster) means that all of our hand wringing over counting homes in the country with speeds of at least 100/20 Mbps is largely a joke. Under any current reasonable definition of broadband, those homes already are at speeds that shouldn’t be counted today as having broadband if the FCC was doing its job.
I really hate the numbers game with broadband, and no matter how we define broadband or set a cutoff for grant eligibility, there will be SPs that will exaggerate the speeds of their current or planned technology to try to game the system. ISPs naturally work to try to protect their service areas from grant funding competition. Other ISPs want to be given grants for technologies that don’t reliably deliver broadband.
But the one thing we should stop doing is measuring broadband by standards that are already in the past in the real world. All of the angst, arguments, and fighting about whether areas are underserved with 100/20 Mbps broadband or slower ought to be scrapped – but unfortunately, the impetus of following grant rules will keep us squabbling about the wrong things for years to come.
Adapted from an article by By Doug Dawson, June 23, 2023 | Original POTs and PANs article here
There was an interesting political effort in the Washington State legislature recently to expand the use of open-access networks. There was language included in House Bill 1147 that would require that any network funded from BEAD grants must become open-access and available to other ISPs.
Open-access has been a topic in Washington for many years. There was a long-time prohibition against Public Utility Districts (PUDs) from offering retail broadband. These county-wide government-owned utilities wanted to bring better broadband and settled by building open-access networks. Over the last few decades, a number of PUDs have launched open-access fiber networks, some of them with tens of thousands of fiber customers.
For those not familiar with open-access, it is a network where multiple ISPs can buy access to reach customers. This provides customers with the choice of using multiple ISP on the same network. All reports are that customers like the extra choices they get. Every broadband survey my firm has ever conducted has shown a huge public preference for choice.
The legislature finally relaxed the prohibition for PUDs last year, but in a bizarre fashion. The legislature passed two conflicting bills that allow PUDs to provide retail broadband services. Rather than choose between the two bills, the Governor signed both simultaneously (a pen in each hand) so that both bills went into effect. As might be imagined, this created as much confusion as clarity over the issue.
I doubt that anybody will be surprised that the biggest ISPs in the state vehemently opposed this legislation. The big cable companies have always immediately fought any suggestion that they allow other ISPs to use their networks. The big telcos were forced to sell unbundled copper loops starting with the Telecommunications Act of 1996, but that requirement continues to wane as the amount of copper keeps shrinking. The telcos started fighting against the unbundling rules as it was enacted, and over the years succeeded in greatly weakening the ability of outsiders to use their copper.
Predictably, the big ISPs in the state of Washington killed this bill. The big ISPs threatened to not pursue any grant funding if this proposal becomes law. Some even made veiled threats to stop investing in the state if this became law.
But it’s an interesting concept. The BEAD grant rules have a clear preference for open-access networks, and any carrier promising an open network will get extra points on a grant application. But the open-access preference is only a suggestion and not a requirement – something the big ISPs in Washington all pointed out.
Requiring open-access is not a far-fetched idea because open-access is required on all of the middle-mile networks that were announced this week as recipients of NTIA grants. But the whole point of the NTIA middle-mile networks is to build networks to places where backbone connections are unavailable or unaffordable. Requiring the grant recipient to sell affordable connections to everybody is a good use of federal grant dollars.
But this raises a much larger question. I know there are a lot of open-access proponents in the country who think that any network funded with government dollars ought to be made open-access to provide the most value to the taxpayers who are funding it. That is exactly what was suggested in Washington, but it didn’t take very long for the big ISPs to kill the idea.
Many industry folks want to take this idea even further. I don’t think I’ve seen a thread on this topic that doesn’t include somebody who thinks government should own all grant-funded fiber infrastructure, which should then be made available to all ISPs that want to use it. Obviously the BEAD grant rules weren’t written that way, and with the sway that big ISPs hold in D.C. it probably never will happen.
It is something that US Congress — or any state legislature — could do if they have the will to enact it. We’re starting to see cities who are adopting this idea, so we’re going to keep seeing new open-access networks coming to life. I have to think that the citizens in every city close to an open-access network is going to be asking why they can’t have the same thing.
By Doug Dawson, June 21, 2023 | Original POTs and PAN article here
The FCC originally budgeted $20.4 billion dollars for the RDOF subsidy program to be spent over ten years. The original RDOF reverse auction offered $16 billion in subsidies. But in a story that is now well known, some entities bid RDOF markets down to ridiculously low subsidy levels, and only $9.4 billion was claimed in the auction and $2.8 billion of that ended up in default, including some of the bidders who had driven the prices so low.
That means that only $6.4 billion of the original $20.4 billion has been allocated. The question I’m asking today is
‘What the FCC will do with the remaining $14 billion?
It seems unlikely that there will ever be another RDOF-like reverse auction. RDOF was meant to bring broadband to areas that were unserved according to the FCC’s broadband maps at the time of the reverse auction – meaning areas where no ISP claimed broadband speeds of at least 25/3 Mbps. But since ISPs are able to claim marketing speeds under the FCC mapping rules instead of actual broadband speeds, many millions of unserved locations were left out of the RDOF process.
Since the RDOF auction, there have been many billions spent to bring broadband to unserved areas through
ReConnect grants;
local ARPA grants;
state broadband grants; and
several smaller grant programs.
To understand how poor the original FCC RDOF maps were, even after these many grants, the latest FCC maps still show over 8 million unserved locations. Folks like me who look at the map at a granular level think there are even more areas that are still mistakenly claimed to have 25/3 Mbps broadband but that don’t in real life.
To be fair, the RDOF is doing some good things. A lot of electric coops, telephone coops, telephone companies, and independent fiber overbuilders are building networks using the RDOF subsidy as the basis for getting funding. Charter and a few other larger ISPs are building networks using the RDOF funding.
But the RDOF awards also left behind a lot of messes. First, it took too long to eliminate the default bidders. Areas claimed by these bidders were off-limits to other federal grants and most state grants – many of these areas would have fiber today had they not been in RDOF limbo.
The bigger problem is that the FCC made an absolute mess by awarding RDOF in what can be best called a checkerboard RDOF serving area. In a particular county (shown here), the areas to the east have no people due to large parklands, but in the rural areas where people live, the RDOF awards covered some areas but not adjacent Census blocks. The Census blocks that were not awarded have the same lousy broadband options and were not included in the RDOF award due to the mapping problems discussed earlier.
This creates a real challenge for anybody now trying to get a BEAD or other grant to serve what is left. The areas left after RDOF don’t make a big coherent serving area, but a jumbled mess of remaining Census blocks. For somebody building a fiber network, these checkerboard areas are a nightmare because a builder must go through RDOF areas to reach the remaining areas. It’s one more factor that will drive up the cost of the BEAD grants in counties that got a lot of RDOF funding.
The FCC is dreadful at awarding grants and subsidies. The RDOF process was used so the FCC didn’t have to review traditional grants where ISPs proposed coherent grant serving areas. This is the same FCC that gave over $11 billion to the biggest telcos for CAF II to upgrade DSL to 10/1 Mbps.
Now that the states have broadband offices, the easiest way for the states to award the remaining RDOF billions would be to let state broadband offices do the heavy lifting. It would be one more tool for state broadband offices – that hopefully would not follow the complicated BEAD rules. The worst possible way to use the money would be for the FCC to take some easy path to shovel the money out the door again – please don’t give us RDOF II!
By Doug Dawson, June 13, 2023 | Orginal POTS and pans article here
The latest Customer Satisfaction Index is out from ACSI, which measures the public satisfaction of a wide range of U.S. industries and institutions. The survey this year continued to show that the public has a poor opinion of ISPs. As a group, ISPs had an average ACSI annual rating of 68. The only industry with a lower rating is gas stations at 65. Subscription TV had an average rating of 69, and the U.S. Post Office had a rating of 70.
But there is some interesting good news for some ISPs. Companies serving customers with fiber rated higher with the public than other ISPs, including cable companies using coaxial networks. Consider the following table that shows the 2023 ranking for fiber and non-fiber ISPs.
Fiber
Non-Fiber
Altice
58
AT&T
80
72
Cable One
71
CenturyLink
78
62
Charter
64
Comcast
73
68
Cox
64
Frontier
74
61
Google Fiber
76
Mediacom
65
T-Mobile
73
Verizon
75
Windstream
70
For companies that offer both fiber and another technology, customers served by fiber liked an ISP more than non-fiber customers. CenturyLink has the biggest difference in satisfaction (78 for fiber and 62 for non-fiber). Frontier also has a dramatic difference (74 fiber and 61 non-fiber). The only cable company ranked for both technologies also has a sizeable difference, and Comcast has a ranking of 73 for its fiber network versus 68 for the coaxial network.
Customer satisfaction involves many other factors than just technology, but the differences for the companies that offer multiple technologies have to be mostly related to fiber. However, there are other factors in play. For example, it seems likely that CenturyLink and Frontier provide better customer service and faster repairs for fiber customers than for DSL customers.
Cable companies have to be noticing this giant difference as part of any consideration of how to upgrade their networks. The big cable companies are all at the beginning of the upgrades to improve upload speeds on coaxial networks, and they must be hoping that customers like them more after the upgrades. But there is a chance that the public has come to think of fiber as a superior technology and will not rank a coaxial system as highly even after speed increases. There is still a noticeable difference in latency and jitter between cable and fiber networks, and customers who see both in action believe fiber is better.
There is still a noticeable range of ISP rankings within each list. Non-fiber customers rate T-Mobile and AT&T the highest and rank Altice and Frontier DSL as the worst ISPs. It’s interesting to see Charter near the bottom of the rankings.
Fiber customers clearly rate AT&T as the best and Comcast Fiber as the lowest. Fiber technical performance should be consistent regardless of the ISP, so the difference in rankings between fiber providers has to be related to customer service and the other non-technical aspects of being an ISP.
By Doug Dawson June 5, 2023 | Original POTS and Pans article here.
As promised, the FCC released a new set of maps on May 30. These are supposed to be the maps that will be used to allocate the $42.5 billion in BEAD grant funding to states. Broadband analyst Mike Conlow quickly published a blog on Substack about the new mapping data that includes a summary of the new map in easy-to-understand tables. Mike’s summary shows that there are more than 114.5 million broadband passings in the country – locations that could be broadband subscribers). That’s an increase of over 1 million locations since the last version of the FCC maps.
More importantly, the new maps can be used to count the number of households that can buy broadband at various speeds. The $42.5 billion in BEAD grant funding will be allocated to states according to the number of unserved locations – places that can’t buy broadband at a speed of at least 25/3 Mbps. Locations are underserved if there is an ISP that offers broadband between 25/3 Mbps and 100/20 Mbps. According to Mike’s quick math, there are 8.67 million unserved locations and 3.55 million underserved locations. Mike subsequently corrected the number of unserved locations to 8.3 million.
Anybody who is intimately familiar with the FCC maps knows that there is a lot of fiction buried in the reporting. There is one huge flaw in the FCC mapping system that has carried over from the previous FCC mapping regime – ISPs self-report the speeds they can deliver. Per the FCC mapping rules, ISPs can claim broadband marketing speeds rather than some approximation of actual speeds. In every county where I’ve delved deep into the local situation, I’ve found multiple ISPs that are overclaiming broadband speeds.
ISPs vary widely in how they report broadband speeds to the FCC. I see some ISPs who meticulously categorize customers into a dozen or more speed tiers. It’s fairly obvious that these ISPs are trying to accurately show the speeds that are available. But there are also ISPs that claim the same speed over a large geographic area. In today’s world, I’m always instantly suspicious of any ISP that claims exactly 100/20 Mbps broadband since that conveniently classifies those locations as served. An ISP making that claim is telling the FCC that everybody in their service footprint already has adequate broadband and that there is no need to give grant money to anybody to compete with them.
But such a claim is ludicrous if the ISP is deploying a technology like DSL, cellular wireless, or fixed wireless where it is impossible that every customer over a wide geographic area to get the ISP’s top claimed speed. Such claims are easy to debunk when you look closely. For example, customers only a few miles from a DSLAM or a tower can’t get the fastest speeds. There are multiple reasons why a given customer’s speed might be slower. Such claims are even more quickly debunked when looking at detailed Ookla speed tests.
A second flaw in the FCC maps is the coverage areas claimed by ISPs. The FCC is counting on public broadband challenges or challenges by State Broadband Offices to somehow fix this problem – but that’s an unrealistic hope. Most people don’t know about the FCC maps and the challenge process – and even people who know about it are not motivated to file a challenge about an ISP that claims service at their home that’s not really available. This issue can apply to any technology, but it’s particularly a problem for WISPs and cellular broadband. It’s not easy for a knowledgeable engineer to accurately judge the coverage area of a wireless network from a given tower – I have to think it’s beyond the capability of the folks at a State Broadband Office to understand it enough to challenge coverage. But it doesn’t take any expertise to know that a WISP or a cellular company claiming ubiquitous 100/20 Mbps coverage across large areas is exaggerating both speed and coverage capabilities.
It’s going to be interesting to see how States react to these final counts. There have been rumors about states ready to sue the FCC and the NTIA if they feel these maps will cheat them out of funding. There has been legislation introduced in the Senate that would force the NTIA to wait longer for better maps before allocating most of the funding. It’s going to be surprising if nobody pops up to challenge the allocation of the $42.5 million dollars. A challenge could plunge the BEAD grants into huge uncertainty.
An even bigger issue is if the FCC maps will be used to determine the locations that are grant eligible – because that would be a travesty. That would mean that every ISP that claims a bogus 100/20 Mbps broadband coverage will be rewarded by keeping out competition from grant funding. Regardless of how the funding is allocated to States, State Broadband Offices need to be the ones to determine which locations in their State don’t have good broadband.
Reader Comment:
I take issue with your statement of suspicion about any ISP showing 100/20 service plans. That is a natural number to pick when arriving at plan speeds. ISP operators are human just like the people the selected 100/20 as the “broadband” speed. Why are we not suspicious of that selection? What if 92/13 would actually suffice? Or 113/ 27? We had a 100/25 plan on our Wisp long before BEAD was a thing. That plan is available to anyone in the coverage that we reported to FCC at fair local market value. You know how we did that? By shrinking our coveragedown to where signal levels are high enough we can deliver that speed. If everyone in that coverage area subscribed to the 100/25 could we support that kind of usage?No.
But guess what? In real life, at fair market value, having plans available from 25/10 to 100/25, we only have a very few people who select anything faster than 25 Mbps. Why? Because with latency at <50 millisecond across our whole network, the people choosing the 25/10 are totally satisfied. The few folks wanting faster can subscribe to our 50 or 100 Mbps plan, and everything works.
Back to the coverage map. The map we use in house is entirely different they the one we reported to FCC. Why? Because of the statement of satisfaction I mentioned about our 25 Mbps plan. As far as I know there is nothing illegal or devious about hooking someone up outside the coverage we reported to FCC. We do it routinely. And if those people call for the 100 Mbps I’m going to tell them it’s not available, or do like any smaller, local friendly, wisp would do and upgrade the sector in their direction to meet the requested speed. We have done that multiple times, ironically well within the 10 day limit given. Let’s see a cable or fiber ISP response like that. So that’s my 2 cents for the day. The high amount of wireless ISP’s reporting 100/x is very likely because they are doing what we have done. Actually mapping coverage to where we can support the “broadband” speed that was arbitrarily selected by humans pulling a number out of a hat. If it was test driven metrics that arrived at the number it would not have been an even 100/20, that is for sure.
If every sub on a fiber ISP got on the net at the same time and did a sustained download and upload test for 1 hour would they all successfully maintain 100/20 for the whole hour? I highly doubt it, so they are over subscribed, just like we are over subscribed. The whole BEAD funding/FCC mapping system, as far as I understand, did not address oversubscription at all, yet it is a reality in every single ISP in existence. So playing totally by the rules, if I can deliver 100/25 (our fastest residential speed) to any one single client in our “FCC stated” coverage area, then I am 100% within the confines of the system that was forced upon us. Because over subscription is real and they left it completely off the discussion table. Real life is radically different than the mythical ideas floating around at the FCC offices. To date, with the new mapping system, we have zero challenges about our coverage, zero complaints about delivering what we advertise, and also zero churn other than people moving out of our service area. With over 75% of our customer base subscribed to our 25/10 service plan.
We use exclusively unlicensed spectrum, so we’re eligible for government funded overbuilding. Our only hope is that our area will be considered high cost and that will discourage a government funded build over. We have over a decade of hard labor building a solid network. No we can’t serve 500 Mbps, but our reviews are 100% positive. As we transition to 60 GHz, we’ll be able to offer a lot higher speeds.
I’m sure there are many WISPS like us across America. It would be nice if there was some slight recognition for the fact that we have been providing solid service to people that the big ISP’s thumbed their nose at for decades.
Doug Dawson Reply Comment:
The problem is that a lot of ISPs are not as scrupulously honest as you are. I’m sure you don’t believe that T-Mobile and Verizon are this honest with customers. There are also plenty of WISPs and DSL ISPs who are claiming marketing speeds in the FCC mapping that are far in excess of what they are actually delivering.
The problem is with the less-than-honest ISPs. Such ISPs can keep away competition from BEAD funding by the simple act of claiming 100/20 Mbps speeds in the FCC maps while delivering something slower. People living in these areas are going to be left behind.
The problem is biggest for cellular wireless. These companies will admit that they can’t begin to serve everybody in an area – they have a natural upper limit on the folks they are willing to serve from a given tower – just like Starlink has done. In areas that are claimed to be served by fast cellular broadband, the majority of folks won’t be able to buy service from the only fast ISP.
My hope is that State Broadband offices look under the hood, on a case-by-case basis to find the real story. They ought to like folks like you, but should not be willing to give grants in areas where the ISP can’t deliver the claimed speeds to everybody.
Applendix A: Estimates from Broadband Analyst Mike Conlow
This version will be used for allocating funds in the NTIA’s BEAD program
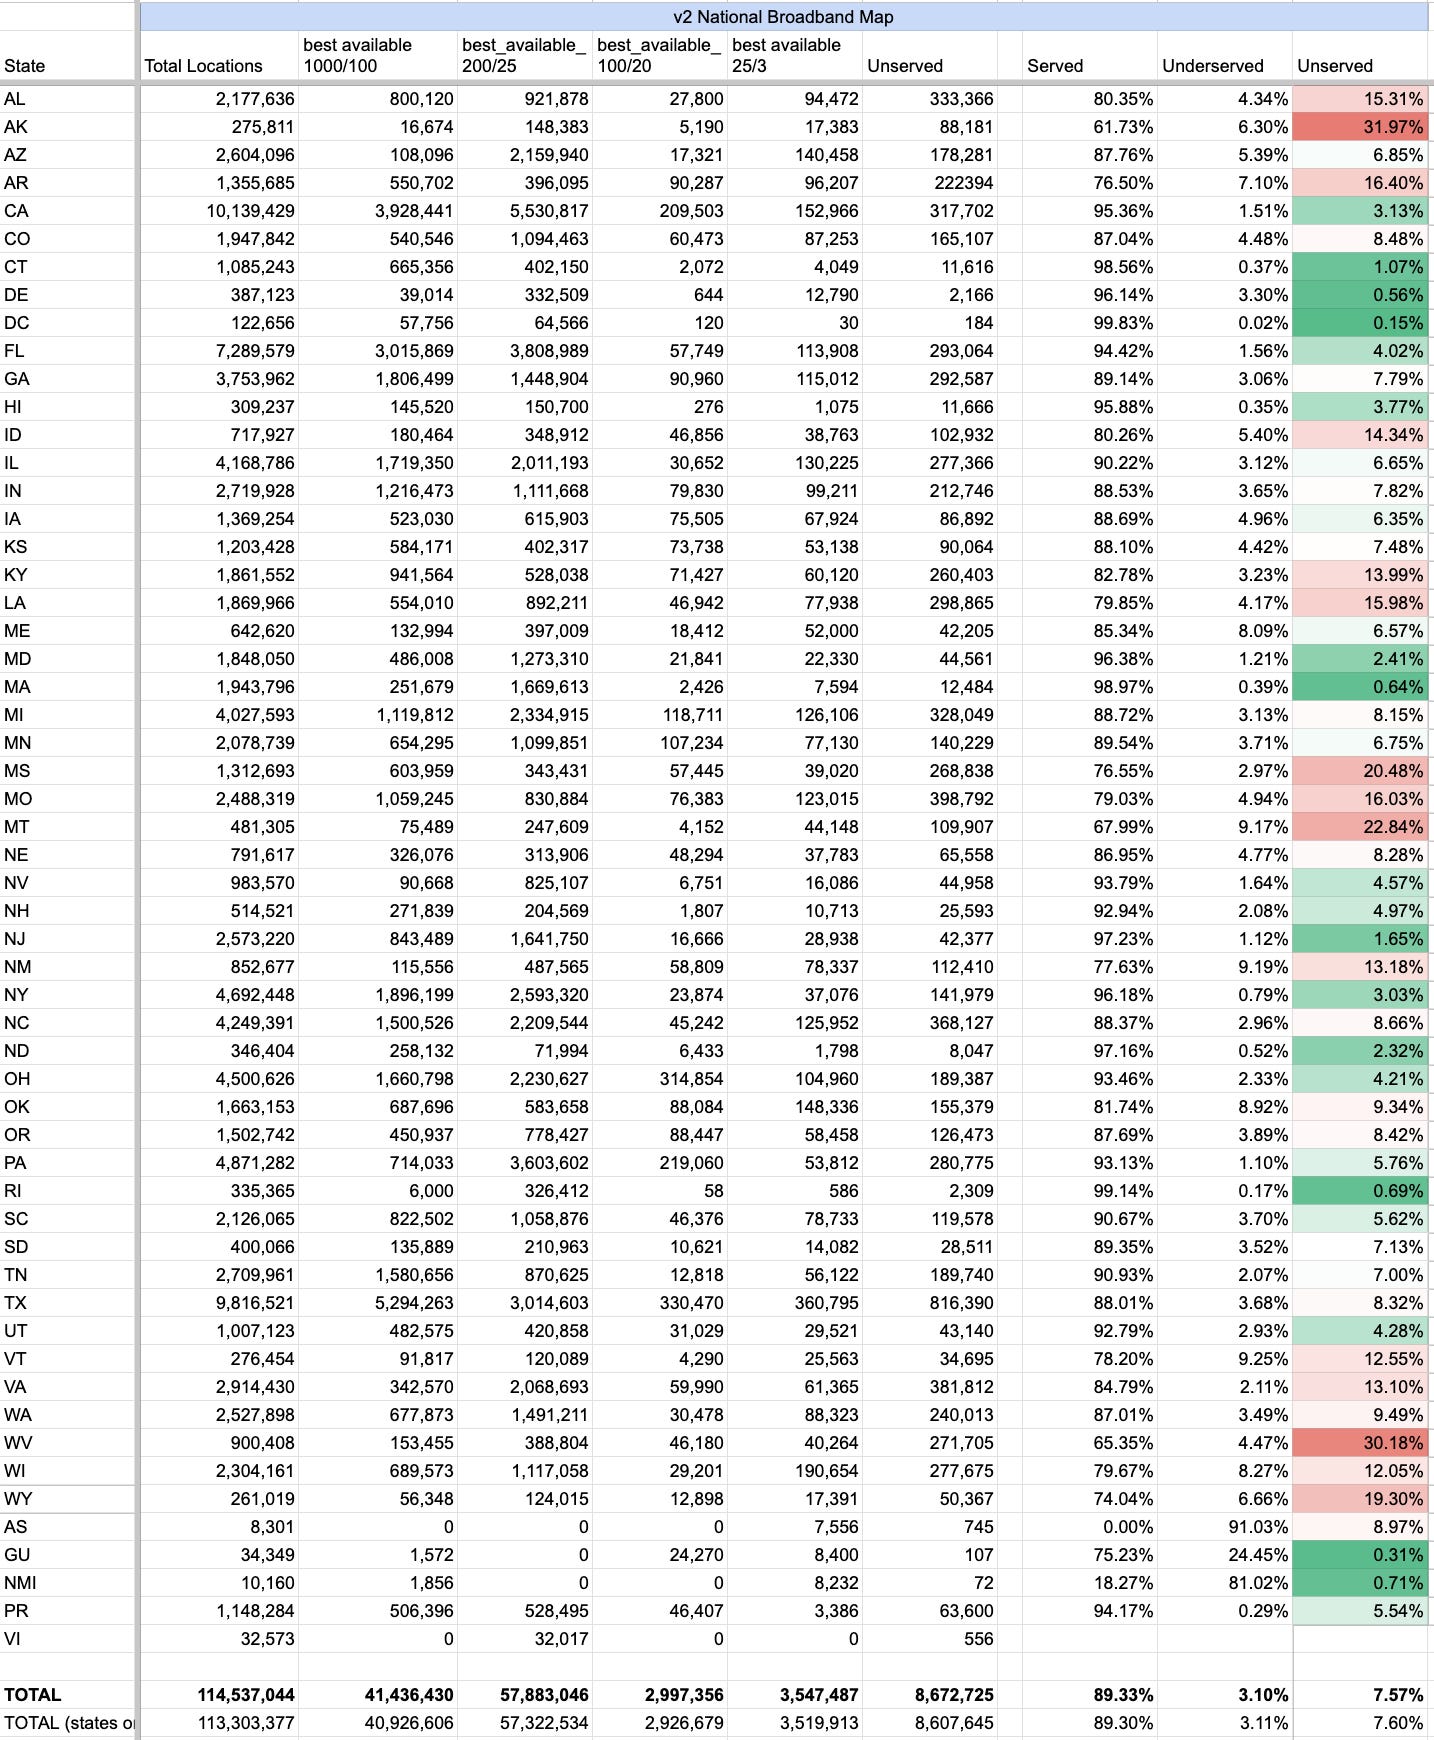
The FCC released an updated National Broadband Map today and I’m ready to share the first version of a state-level analysis. This is the version of the map that will be used by the NTIA to allocate $42.5 billion in the Broadband Equity, Access, and Deployment (BEAD) program. I’ll provide the top lines here and more detailed methodology and caveats are below. Overall, as of December 31, 2022, there are 114,537,044 Broadband Serviceable Locations (BSLs) in the country (including territories). That’s a net addition of 1 million BSLs.
7.6% of the BSLs are Unserved, or 8.3 million nationally.
3.1% of the BSLs are Underserved, or 3.5 million nationally.
For California, that is 10,139,429 Broadband Serviceable Locations
3.2% of the BSLs are Unserved, or 317, 702 statewide
1.5% of the BSLs are Underserved, or 152, 091 statewide
There are some surprises. Michigan, for example, lost 71,139 Unserved locations, an 18% decline, which leads to a $416 million lower allocation. (This deserves further investigation). North Dakota, Indiana, Florida, Georgia, and South Dakota also have double digit loses in the percentage of Unserved. (Lower Unserved numbers mean the maps show more locations as Served or Underserved, which lowers the allocation to the state).
In some states, the addition of Unserved locations is dramatic. Alaska’s Unserved locations grew 84% to 88,181 increasing their allocation to $166 million. There were a lot of other states with big increases: Nebraska (+225%), Iowa (+124%), Oregon (+70%), Kansas (+61%), and North Carolina (+45%).
(All of my comparisons to the previous National Broadband Map v1 are from the original data released by the FCC last November, with the exception of Illinois and Hawaii, which were updated. My understanding is, other than Illinois and Hawaii, the corrections to the v1 National Map have been minor.)
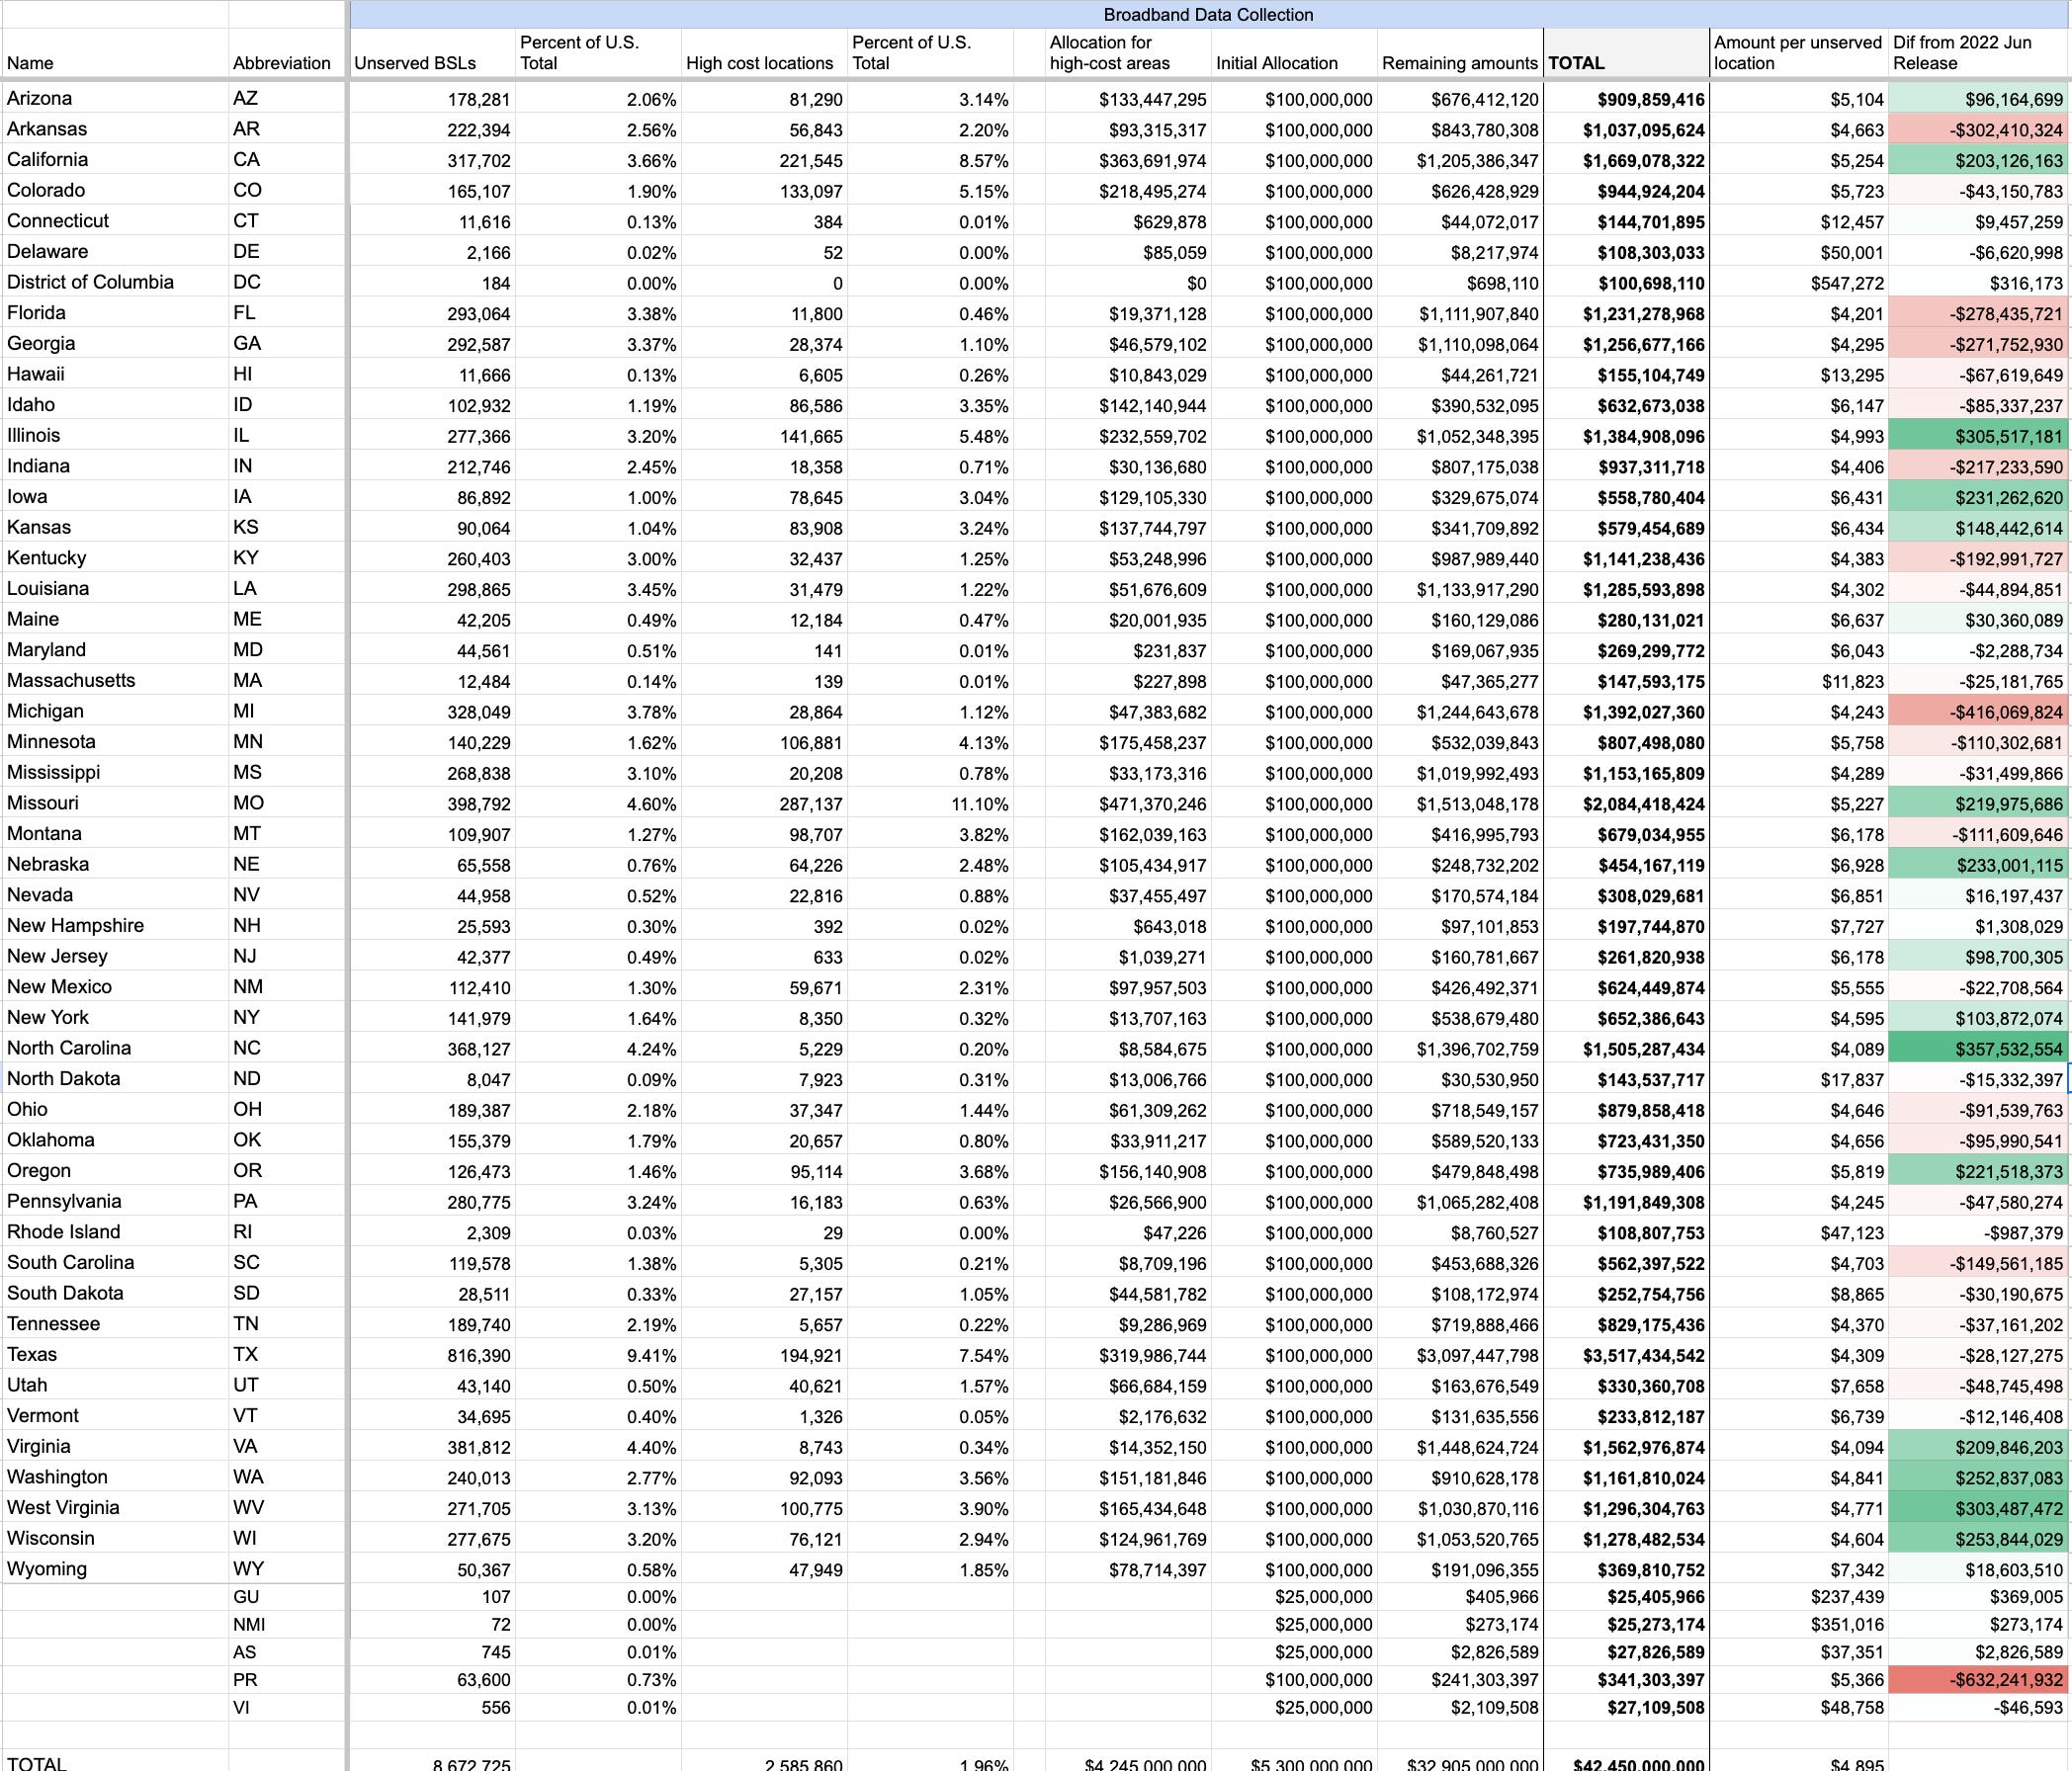
The big news is the projected allocation of the $42.5 billion. NTIA plans to release the allocations at the end of June, so it is more than likely that with the release of this data, the allocation levels are now set.
img
Ten percent of the overall allocation is based on the number of “high cost locations” in each state. To my knowledge, NTIA still hasn’t published how they plan to determine how many high cost locations each state has. As an estimate, I use numbers I generated in previous analysis that are themselves based on the reserve prices from the FCC’s RDOF reverse auction.
These allocation estimates include the territories, since that is how the allocation will be done by NTIA. However this allocation could undercount Unserved locations in the territories since the broadband coverage options are fewer. For example, in the previous release I had Puerto Rico with 213,000 Unserved out of 1.16 million BSLs. In this version, I get 63,600 Unserved out of 1.15 million BSLs. That leads to a minus $632 million swing for Puerto Rico (money that goes to other states). If the FCC releases authoritative numbers of BSLs and housing units in each Census block I’ll update these numbers.
If there are updates/changes/corrections to these numbers, I’ll post them as updates to this page or new posts.
I will have much more analysis on what’s changed since the first fabric release, and what this means for where things stand on broadband deployment in the future.
If you wish to cite these numbers, please do so as “estimates from broadband analyst Mike Conlow” and link to this Substack post. As always, if you want to reach me you can respond to the Substack emails and it will get to me.
Adapted from a commentary by Larry Ortega, Oct 20, 2021 | Original Cal Matters commentary here.
Larry Ortega is founder of Community Union Inc., a nonprofit corporation that trains consumers living in the digital divide, and a 35-year veteran of the technology sector.
Summary: The American Legislative Exchange Council (ALEC) and Telecoms Cos. are working in tandem to ensure that consumers in California and the U.S. DO NOT get access to world-class telecommunication services.
For almost 30 years, America’s telecom companies have been receiving billions of dollars in rate increases and extra fees to finance the build-out of a national fiber optic network. Along the way, they discovered that such a network would hamper their opportunity to make a financial killing with wireless technology. So in 2010, they stopped upgrading phone customers with fiber optics, thus widening the digital divide and leaving millions of Americans unconnected.
This is not just another digital divide story about rural or inner-city residents who lack access to broadband services. This is a story about a skillfully thought-out, well-financed scheme that involves the American Legislative Exchange Council (ALEC), Koch Industries (the largest privately held company in the U.S.) and a gang of lobbyists joining forces to write legislation.
This legislation would use the levers of state government to fast-track the deployment of an unregulated and a highly profitable wireless business. In state after state, the same political forces that are legislating away voting rights and increasing the power of corporations are pushing to fast-track 5G legislation under the guise of fixing the digital divide.
The wireless industry claimed that rapid deployment of densifed 4G/5G technology will bring great new benefits to consumers, and just like that, almost every one of our California legislators climbed on board. What the industry purposefully omits is that fiber optics (wired) connections are 10,000 times faster than 5G, more secure, less expensive for the consumer — and future-proof.
In fact, it was the phone companies themselves that abandoned the completion of fiber connections midstream, leaving millions of miles of “dark fiber” in the ground. A 2018 Network Exam by the California Public Utilities Commission detailed how abandoning fiber optic upgrades to low-income and rural areas left consumers with wireless-only options. This is a well-known — and unethical — strategy called “harvesting.”
These attacks on consumers by ALEC and the telecommunications industry have been constant. Gov. Gavin Newsom faced off with telecom when he was mayor of San Francisco. Federal Communication Commission Commissioner Brendan Carr had fought the city’s effort to ensure consumer protections. Carr wrote the FCC’s current regulations on 5G, known as Carr’s 5G Orders.
These orders obliterate state and local government oversight of infrastructure build-out, throwing out both financial and physical safety protocols, all in the name of a race to third place. Even when 5G can be successfully deployed, it is still slower than fiber optics and cable TV.
ALEC, Carr and the phone companies are working in lock-step to ensure that consumers in California and the U.S. do not get access to world-class telecommunication services. Fiber optic upgrades would slash profits by hundreds of billions of dollars, breaching telecoms’ fiduciary duty to their shareholders. The telecoms want no part of profit-slashing and therefore have chosen to drive a strategy thatensures the persistence of a digital divide.
Community groups, unions (such as the Communication Workers of America) and parents who well understand that their children will be harmed by unregulated deployment of wireless infrastructure have figured out this grift. They recently asked for, and were granted, the governor’s veto on Senate Bill 556 (Sen. Dodd), one of the four ALEC telecom bills in the 2021 legislative session. The three other 2021 ALEC telecom bills which were signed by Gov. Newsom
AB.537 (Asm. Quirk) | Chaptered in 2021 | [Tele]communications: wireless telecommunications and broadband facilities. (the “Deemed Approved, Deemed Permit-Issued” Wireless Bill)
AB.955 (Asm. Quirk) | Enrolled in 2021 | Highways: encroachment permits: broadband facilities. (the “CA Streets and Highways Deemed Approved” Wireless Shot Clock Bill)
SB.378 (Sen. Gonzalez) | Chaptered in 2021 | Local government: broadband infrastructure development project permit processing: microtrenching permit processing ordinance. (the “Cheap Micro-Trenching & No Public Access to Fiber” Bill)
. . . should get repealed in 2022, along with 2015’s AB.57 (Asm. Quirk), another unnecessary shot clock bill that is inconsistent with the 1996 Telecommunications Act.
AB.57 (Asm. Quirk) | Chaptered in 2015 | Telecommunications: wireless telecommunication facilities. (the “Unnecessary Wireless Shot Clock” Bill)
Are you seeing the theme, here? Assembly member Quirk is the ALEC/Telecom go-to-guy. Why is that?
Follow the money . . . Voters should respond, accordingly.
The effort to defeat SB.556 was a massive grassroots undertaking. This cohort of consumers and advocates prevailed in 2021, just as they had on securing a veto of SB.649 another ALEC/Telecom bill from 2017. They are sending a clear message to the Wireless industry — stay out of California’s residential zones.
The veto of SB.556 is a victory for local governments in California, and cities should now respond by passing local ordinances that protect the residential zones and keep any densified 4G/5G Wireless grid only in commercial and industrial zones.
But we must remain vigilant because ALEC and its friends have a history that has had a devastating impact on families living with the digital divide:
2012’s SB 1161, which the CPUC Network Exam points to as a culprit in exacerbating the digital divide;
2017’s SB 649, which was vetoed by Gov. Jerry Brown;
Consumers, telecoms and our legislators are charged with the task of ensuring that all Californians have quality, high-speed, fiber optic access to online resources, be they in the rural cities of Huron, Mendota or Firebaugh or the inner-city of MacArthur Park, Huntington Park or Leimert Park neighborhoods of Los Angeles.
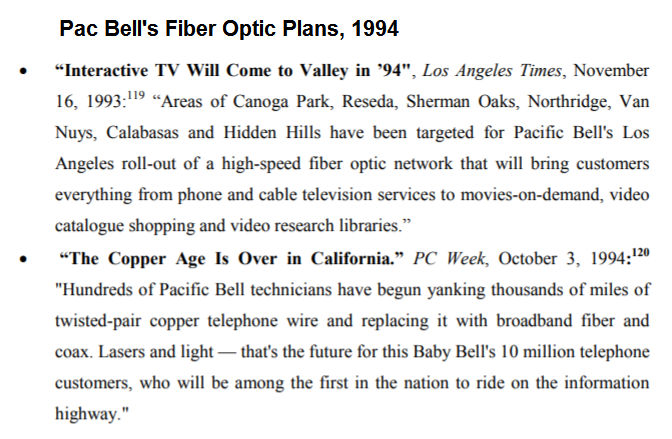
It is time for the governor to call for an investigation into why these ALEC bills keep landing on his desk. Consumers deserve to know how it is that the telecom industry’s plans since 1993 to upgrade consumers with fiber optics still have not been delivered.
At no point did consumers agree to a more expensive, less efficient wireless network. Wireless technology has its application, but to reiterate, 5G is 10,000 times slower than fiber optics, requires higher maintenance and will consume much more energy than fiber optics once deployed, guaranteeing a larger, not smaller, carbon footprint.
We might begin by looking at increasing oversight of fiber optics deployed under Title II of the Communications Act of 1934 — a federal mandate that all customers shall be served. This increased oversight, by itself, might be able to close the digital divide.
October 5, 2021 | Original Surviving Sacramento article here
Of the three Big Wireless sponsored legislation, one remains: Senate Bill 378
The California Public Utilities Commission has established rules regarding underground utility infrastructure — generally designed to prevent hitting a gas, electric, or other utility infrastructure. Senate Bill 378 requires local government to allow fiber-optic lines to be installed in narrow excavated trenches — microtrenches. SB 378 does NOT specify whether fiber installers would have to comply with the safety requirements established by the CPUC.
This past week, Governor Gavin Newsom signed Assembly Bill 537, which places strict timelines for cities and counties to review and respond to cell tower transmitter applications. If the local municipality cannot meet a 60-day timeline, according to AB 537, the application will be deemed approved, the permit considered issued, and the wireless company can start construction immediately.
The legislation is supported by Verizon, AT&T, T-Mobile, TowerCo, Crown Castle, and the Wireless Infrastructure Association.
Yet, Gov. Newsom vetoed Senate Bill 556, protecting local control over the placement, construction and operations of Wireless Telecommunications Facilities (WTFs) of any size or any “G”.
SB-556 would have compelled local governments to give Big Wireless nearly free access to the streetlight and traffic signal poles to install cell tower transmitters. This legislation would have overridden local agreements with Big Wireless, overridden local zoning laws, and severely limited control over when and where the “small” Wireless Telecommunications Facilities (sWTFs) would be constructed.
In his https://www.gov.ca.gov/wp-content/uploads/2021/10/SB-556-Message-Scan.pdf> Gov. Newsom said:
“I am returning Senate Bill 556 without my signature.
This bill would restrict the ability of local governments and publically-owned electric utilities to regulate the placement of small cell wireless facilities on public infrastructure and list the compensation that may be collected for use of these public assets.
In 2018, the Federal Communications Commission (FCC) adopted many of the requirements that this bill seeks to codify. The provision of this bill, however, conflict with and complicate for of the FCC requirements. Further, it would be imprudent to codify these requirements in state law in the event the FCC revises them.”
It is hard to imagine Governor Newsom signing legislation that raises critical questions about micro-trenching fiber optic lines without appropriate safeguards established by the California Public Utilities Commission. These safeguards seek to prevent excavation projects from hitting the gas, electric, or other utility infrastructure. But then again, it has been a strange and wild 2021 legislative session.
Adapted from an article by Bruce Kushnick, Spet 22, 2021 | Original Medium article here.
Follow the Money . . .
And Then Do Not Sign the Industry-Based Wireless Bills
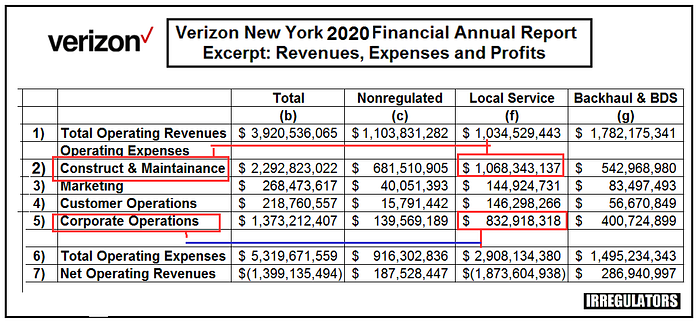
The following table could be worth over $1–2 billion dollars annually to the state of California from a State Public Telecommunications Utility (SPTU) named AT&T-California (formerly called “Pacific Bell”), particularly if the California Annual Financial Report matches what has been going on with New York state’s SPTU, Verizon-NY. As one can see, there are massive financial cross-subsidies revealed in this table. (This is an excerpt from the Verizon NY 2020 Annual Report, published May 27th, 2021.)
img
This is the third of three letters on this topic. The previous two letters can be found at the following links:
Letter 1 addresses the three corporate-sponsored wireless bills, all that deserve to be vetoed:
Each of these bill do not solve the Digital Divide and give unnecessary gifts to Big Wireless at the expense of California’s counties, cities and resdidents. These bills are self-serving and appears to be created with the help of the American Legislative Exchange Council (ALEC). This letter also gives a brief history of the failed fiber optic deployments in CA by Pacific Bell/AT&T California.
Letter 2 focuses on the failed fiber optic deployments in California that were all the rage in the 1990’s, including the plans to have San Diego CA, fully upgraded to fiber optics by the year 2010. By 2000, 5.5 million homes should have been upgraded and $16 billion was supposed to have been spent — but that never happened.
How Can CA get fiber optic broadband infrastructure to all, at reasonable rates?
This letter details what is mostly hiding in plain sight, lost or unknown due to institutional amnesia. This article summarizes some of the revenues and expenses from Verizon-NY, which will parallel what can be found in AT&T-California’s financial reports. Unfortunately, the AT&T CA Annual Reports are not available to the public — only the work done by the CPUC and released, unredacted, in January, 2021.
And anyone who has ever read a financial spreadsheet of revenues and expenses, in glancing at the numbers in the opening graphic, will most likely start laughing or crying. How can Local Service, which are the revenues from the basic copper-based phone service, be paying $833 million dollars in Corporate Operations expenses? (Line 5, Column f) in just NY, in just 2020? Worse, $1.1 billion in construction and maintenance has been charged to the Local Service line of business, yet these networks are not being upgraded. (Line 2, Column f). In fact, there are plans to ‘shut off the copper’ which have been around for the last decade.
With revenue for Local Service of only $1 billion, this accounting has been manipulated to put the majority of Corporate Operations expenses, and the construction expenses, into the regulated Local Service classification while the other unregulated lines of business listed are getting a free ride.
This Financial Shell Game is the Digital Divide; These financial machinations have been used to NOT upgrade whole areas of NY State, as well as California, and the billions in construction funds that were intended to maintain the copper infrastructure and to upgrade the network to a fiber optic infrastructure, were illegally diverted to fund the affiliated wireless infrastructure and the other lines of the media content businesses and foreign telecom investments. This Financial Shell Game has been used for multiple rate increases based on claims that the copper infrastructure was losing money, as well as used as an excuse to cut staff and move the business to wireless. In NY, this has meant leaving rural areas and low-income urban areas with no serious broadband competition and slow DSL service. Moving the billions back to build out the high-speed, fiber optic wired infrastructure — should be the next step.
YES, these financials of Verizon NY should match AT&T California — they use identical deformed accounting formulas.
On May 27th, 2021, the Verizon NY 2020 Annual Report was published — and it is important because it is based on the exact same accounting formulas that AT&T California is using — the FCC Cost Accounting rules known as the “USOA”, “Uniform System of Accounting”. And, as we will discuss, the formulas that allocate the expenses to the different lines of business have been manipulated to make one line of business, Local Service, pay the majority of expenses, — while the other lines of business, such as FiOS, DSL, VoIP, Business Data, or wireless services are paying a fraction of the expenses that they should be.
On October 26th, 2020, the IRREGULATORS filed comments with the CPUC and the Broadband Council. We estimate that there is $1.7-$2.4 billion in potential overcharging annually of Local Service, by AT&T, the primary state telecommunications public utility. This money should be redirected to build out the fiber optic networks, which can be used by municipalities or as open access networks — not controlled by AT&T.
Let’s start with a few items in the Verizon NY Annual Report, and the basis of the presentation. There are three major lines of business in these financials using the copper and fiber wires:
“Nonregulated”, (Column C) which are the FiOS video, and VoIP (digital voice), or services that were once regulated.
“Local Service”, (Column F) the revenues from the ‘regulated’ the basic copper-based phone service.
“Access” (Column G) or sometimes called “Business Data Services”, (“BDS”) or “backhaul”, which are the wires to the cell sites or used by banks providing data services.
Do AT&T CA’s financial reports match Verizon NY and do the manipulated accounting formulas match? Yes.
1. Both Verizon NY and AT&T California are state-based telecommunications public utilities hiding in plain sight. Through institutional amnesia, no one we spoke to knows that there are still state telecom utilities, or that the wires are put in and classified as Title II services.
2. Same Accounting: They both rely on the corrupted USOA accounting — even though they filed with the FCC to stop this practice in 2007. (In fact, Brendan Carr, now an FCC Commissioner, was one of Verizon’s attorneys in these proceedings.)
3. Same Accounting Manipulations via a ‘Freeze’ — The accounting formulas that allocate the expenses were frozen by the FCC to match the year 2000 and were never changed over the last 2 decades — nor any adjustments. In 2000, Local Service was 65% of the revenues and it paid 65% of the expenses — by 2021, Local Service was 20–24% of the total revenues but it still is paying almost 60% of the expenses.
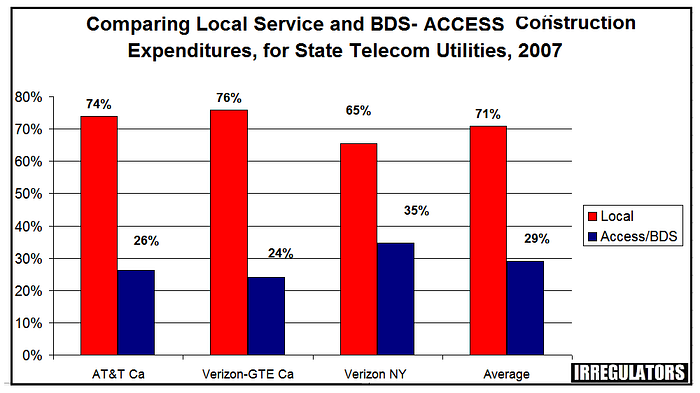
4. The last data from the FCC on construction expenditures matched. Throughout America, the local service classification was charged, on average, over 71% of the total construction expenses in 2007, while “BDS” only paid 29%.
The last FCC data collected was for the year 2007. Using “Construction and Maintenance”, (known as “specific” and “nonspecific” “Plant”) we compare AT&T California and Verizon New York. (We also added Verizon-GTE, which was sold to Frontier); the national average we found for 2007; 71% of expenses for construction were put into Local Service, not Access Services.
This is ludicrous as it should have been the other way around, especially in 2020; there has been no serious construction of the copper networks for a decade. We note that there are different sections of the annual report tells a more detailed story.
5. The expenses for Construction were charged to Local Service but were not spent on the networks. And here is the problem — All of AT&T California is one big sink-hole of cross-subsidies.
“Over the full 2010–2017 period, less than 1% of all AT&T capital spending on network plant additions, just under $47 million, was for outside plant rehabilitation projects.
“Extraordinarily small portions of AT&T California’s Plant Additions and Maintenance expenditures have been directed at legacy POTS (Plain Old Telephone Service) services over the 2013–2017 period.”
Yes, this says that AT&T CA spent under $50 million to maintain and repair the basic entire network in California for 8 years. The CA PUC information stops in 2017.
And this is almost identical to Verizon NY, where the expenses that were charged to Local Service were NOT used to upgrade the network. In Verizon NY, overall, local service used only $41 million for 2020, and averaged only $30 million a year on the construction.
This means that on the opening chart, the $1.1 billion in construction and maintenance is overcharged over $1 billion, is most likely being used illegally by Verizon’s wireless subsidiary,
6. The Kicker to the Allocation of Construction Expenses — An Almost Two Decade Model.
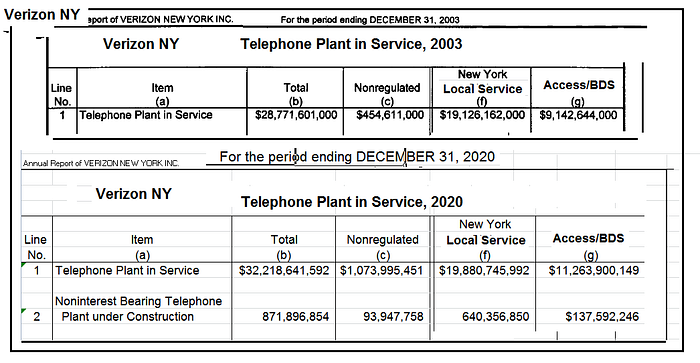
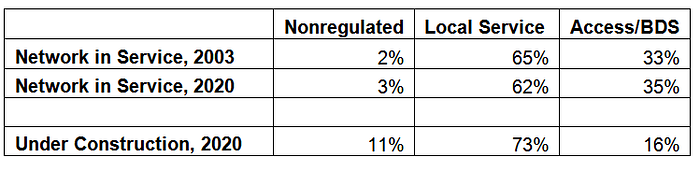
This next chart is taken directly from the Verizon NY 2003 and 2020 Annual Reports and it shows that since 2003, virtually 60+ of the construction was charged to Local Service, while the “construction in progress” in NY had 73% put into Local Service.
Just look at the summary of the ‘Networks in Service’ for the years 2003 and 2020, and the percentage of the expenses by line of business, and the ‘under construction’ for 2020.
What this shows is that for almost 2 decades, the entire state wired infrastructure was charged to Local Service; Nonregulated, including FiOS, has been getting a free ride, while BDS, with about double the revenues, is paying ½ of what Local Service paid. And in 2020, Local Service paid a whopping 73% but it did not go to do construction and maintenance.
NOTE: The differences with the opening chart is that the networks have different types of copper and fiber and they are classified in different ways.
Halting these illegal cross-subsidies to the other lines of business would insure that those funds that should have been used for fixing the Digital Divide now be used to deliver what was ignored over the last decade.
As we noted, AT&T CA stated that the wireless networks were being subsidized by the wireline networks. But these entire financial reports are a collection of shell games.
And most important, based on the CPUC Network exam report, these cross-subsidies appear to be identical.
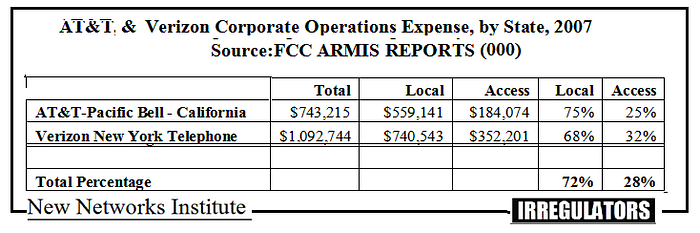
7. Corporate Operations Expense has also been Manipulated
Using the FCC’s last financial report, this chart shows that Local Service was charged 72% of corporate expenses, on average for America, and that AT&T CA allocated 75% of the total; Verizon NY was charged 68%, but — the total amount actually varies by year.
In short, what we have uncovered is the ongoing cross-subsidy of Verizon NY and Verizon’s other lines of business, including wireless, and halting this illegal flow of money could result in billions of dollars that should/could be used to properly upgrade the entire state with fiber optics.
We assume the same applies to AT&T California.
The proposed corporate-funded wireless legislation has been pushed via these cross-subsidies as well and the corporate expenses are obviously the same monies used to influence politicians and fund lobbyists and even ALEC.
With billions of dollars per year that could restructure the future in California, we hope you take our analyses seriously and implement our findings and recommendations.
By Bruce Kushnick, Sept 21, 2021 | Original Medium article here.
Senator Hueso, Chairman of the Standing Committee on Energy, Utilities and Communications, should be well aware of these facts.
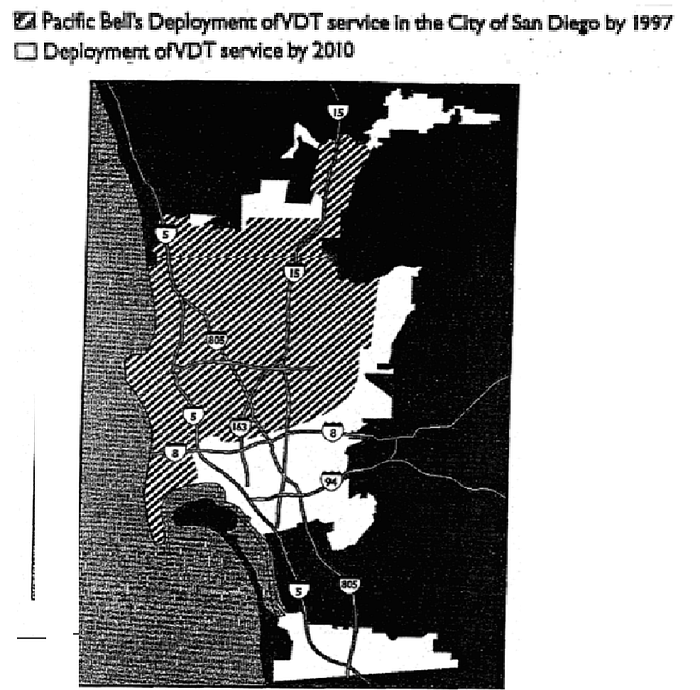
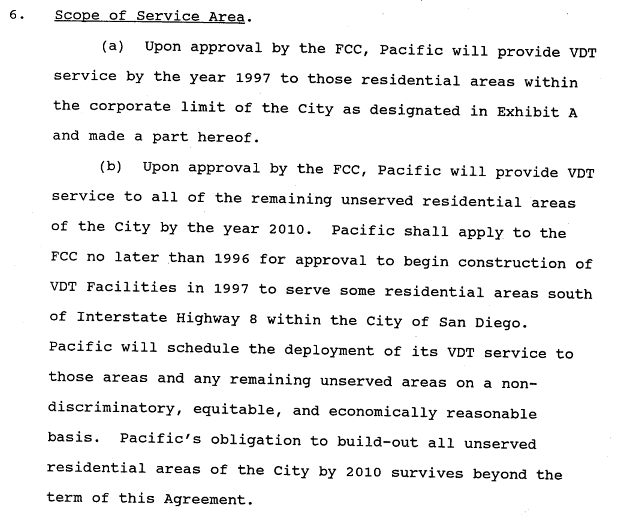
A. Pacific Bell’s “landmark” agreement with the city of San Diego to be upgraded to fiber optics, here called ‘VDT” — Video Dialtone — by 2010. Here is the map of San Diego, CA and the coverage with fiber optics to all by 2010.
B. The Landmark Deal with San Diego: Unserved Areas Completed by 2010
C. All of California was supposed to be upgraded, starting in 1994.
Rise and Fall of the Fiber Optic Future in CA, as told by the San Diego Tribune**
No audits or investigations of any note were ever directed by CA’s elected representatives. Why?