
By Doug Dawson June 5, 2023 | Original POTS and Pans article here.
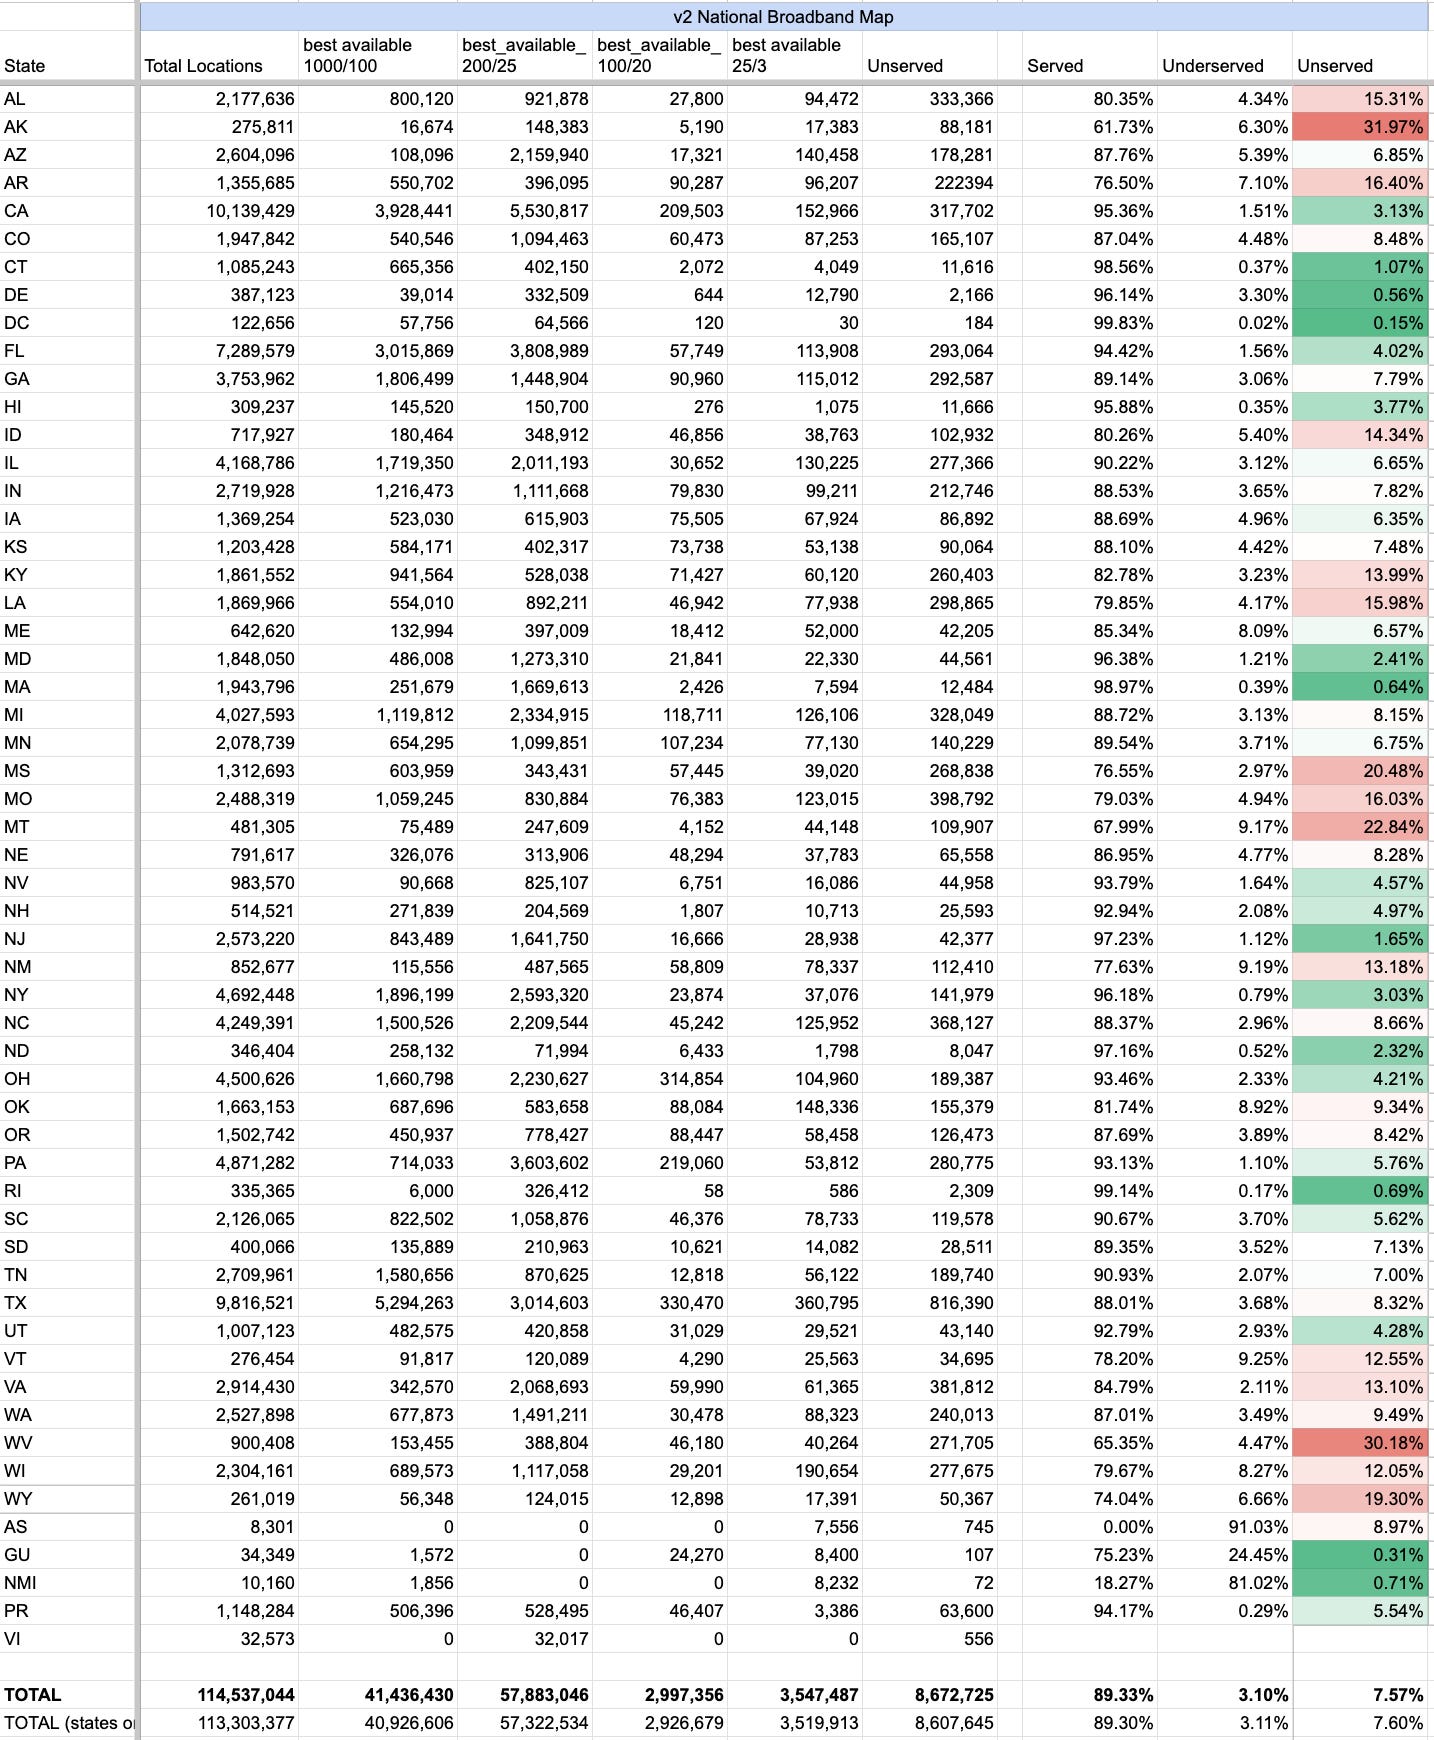
As promised, the FCC released a new set of maps on May 30. These are supposed to be the maps that will be used to allocate the $42.5 billion in BEAD grant funding to states. Broadband analyst Mike Conlow quickly published a blog on Substack about the new mapping data that includes a summary of the new map in easy-to-understand tables. Mike’s summary shows that there are more than 114.5 million broadband passings in the country – locations that could be broadband subscribers). That’s an increase of over 1 million locations since the last version of the FCC maps.
More importantly, the new maps can be used to count the number of households that can buy broadband at various speeds. The $42.5 billion in BEAD grant funding will be allocated to states according to the number of unserved locations – places that can’t buy broadband at a speed of at least 25/3 Mbps. Locations are underserved if there is an ISP that offers broadband between 25/3 Mbps and 100/20 Mbps. According to Mike’s quick math, there are 8.67 million unserved locations and 3.55 million underserved locations. Mike subsequently corrected the number of unserved locations to 8.3 million.
Anybody who is intimately familiar with the FCC maps knows that there is a lot of fiction buried in the reporting. There is one huge flaw in the FCC mapping system that has carried over from the previous FCC mapping regime – ISPs self-report the speeds they can deliver. Per the FCC mapping rules, ISPs can claim broadband marketing speeds rather than some approximation of actual speeds. In every county where I’ve delved deep into the local situation, I’ve found multiple ISPs that are overclaiming broadband speeds.
ISPs vary widely in how they report broadband speeds to the FCC. I see some ISPs who meticulously categorize customers into a dozen or more speed tiers. It’s fairly obvious that these ISPs are trying to accurately show the speeds that are available. But there are also ISPs that claim the same speed over a large geographic area. In today’s world, I’m always instantly suspicious of any ISP that claims exactly 100/20 Mbps broadband since that conveniently classifies those locations as served. An ISP making that claim is telling the FCC that everybody in their service footprint already has adequate broadband and that there is no need to give grant money to anybody to compete with them.
But such a claim is ludicrous if the ISP is deploying a technology like DSL, cellular wireless, or fixed wireless where it is impossible that every customer over a wide geographic area to get the ISP’s top claimed speed. Such claims are easy to debunk when you look closely. For example, customers only a few miles from a DSLAM or a tower can’t get the fastest speeds. There are multiple reasons why a given customer’s speed might be slower. Such claims are even more quickly debunked when looking at detailed Ookla speed tests.
A second flaw in the FCC maps is the coverage areas claimed by ISPs. The FCC is counting on public broadband challenges or challenges by State Broadband Offices to somehow fix this problem – but that’s an unrealistic hope. Most people don’t know about the FCC maps and the challenge process – and even people who know about it are not motivated to file a challenge about an ISP that claims service at their home that’s not really available. This issue can apply to any technology, but it’s particularly a problem for WISPs and cellular broadband. It’s not easy for a knowledgeable engineer to accurately judge the coverage area of a wireless network from a given tower – I have to think it’s beyond the capability of the folks at a State Broadband Office to understand it enough to challenge coverage. But it doesn’t take any expertise to know that a WISP or a cellular company claiming ubiquitous 100/20 Mbps coverage across large areas is exaggerating both speed and coverage capabilities.
It’s going to be interesting to see how States react to these final counts. There have been rumors about states ready to sue the FCC and the NTIA if they feel these maps will cheat them out of funding. There has been legislation introduced in the Senate that would force the NTIA to wait longer for better maps before allocating most of the funding. It’s going to be surprising if nobody pops up to challenge the allocation of the $42.5 million dollars. A challenge could plunge the BEAD grants into huge uncertainty.
An even bigger issue is if the FCC maps will be used to determine the locations that are grant eligible – because that would be a travesty. That would mean that every ISP that claims a bogus 100/20 Mbps broadband coverage will be rewarded by keeping out competition from grant funding. Regardless of how the funding is allocated to States, State Broadband Offices need to be the ones to determine which locations in their State don’t have good broadband.
Reader Comment:
I take issue with your statement of suspicion about any ISP showing 100/20 service plans. That is a natural number to pick when arriving at plan speeds. ISP operators are human just like the people the selected 100/20 as the “broadband” speed. Why are we not suspicious of that selection? What if 92/13 would actually suffice? Or 113/ 27? We had a 100/25 plan on our Wisp long before BEAD was a thing. That plan is available to anyone in the coverage that we reported to FCC at fair local market value. You know how we did that? By shrinking our coverage down to where signal levels are high enough we can deliver that speed. If everyone in that coverage area subscribed to the 100/25 could we support that kind of usage? No.
But guess what? In real life, at fair market value, having plans available from 25/10 to 100/25, we only have a very few people who select anything faster than 25 Mbps. Why? Because with latency at <50 millisecond across our whole network, the people choosing the 25/10 are totally satisfied. The few folks wanting faster can subscribe to our 50 or 100 Mbps plan, and everything works.
Back to the coverage map. The map we use in house is entirely different they the one we reported to FCC. Why? Because of the statement of satisfaction I mentioned about our 25 Mbps plan. As far as I know there is nothing illegal or devious about hooking someone up outside the coverage we reported to FCC. We do it routinely. And if those people call for the 100 Mbps I’m going to tell them it’s not available, or do like any smaller, local friendly, wisp would do and upgrade the sector in their direction to meet the requested speed. We have done that multiple times, ironically well within the 10 day limit given. Let’s see a cable or fiber ISP response like that. So that’s my 2 cents for the day. The high amount of wireless ISP’s reporting 100/x is very likely because they are doing what we have done. Actually mapping coverage to where we can support the “broadband” speed that was arbitrarily selected by humans pulling a number out of a hat. If it was test driven metrics that arrived at the number it would not have been an even 100/20, that is for sure.
If every sub on a fiber ISP got on the net at the same time and did a sustained download and upload test for 1 hour would they all successfully maintain 100/20 for the whole hour? I highly doubt it, so they are over subscribed, just like we are over subscribed. The whole BEAD funding/FCC mapping system, as far as I understand, did not address oversubscription at all, yet it is a reality in every single ISP in existence. So playing totally by the rules, if I can deliver 100/25 (our fastest residential speed) to any one single client in our “FCC stated” coverage area, then I am 100% within the confines of the system that was forced upon us. Because over subscription is real and they left it completely off the discussion table. Real life is radically different than the mythical ideas floating around at the FCC offices. To date, with the new mapping system, we have zero challenges about our coverage, zero complaints about delivering what we advertise, and also zero churn other than people moving out of our service area. With over 75% of our customer base subscribed to our 25/10 service plan.
We use exclusively unlicensed spectrum, so we’re eligible for government funded overbuilding. Our only hope is that our area will be considered high cost and that will discourage a government funded build over. We have over a decade of hard labor building a solid network. No we can’t serve 500 Mbps, but our reviews are 100% positive. As we transition to 60 GHz, we’ll be able to offer a lot higher speeds.
I’m sure there are many WISPS like us across America. It would be nice if there was some slight recognition for the fact that we have been providing solid service to people that the big ISP’s thumbed their nose at for decades.
Doug Dawson Reply Comment:
The problem is that a lot of ISPs are not as scrupulously honest as you are. I’m sure you don’t believe that T-Mobile and Verizon are this honest with customers. There are also plenty of WISPs and DSL ISPs who are claiming marketing speeds in the FCC mapping that are far in excess of what they are actually delivering.
The problem is with the less-than-honest ISPs. Such ISPs can keep away competition from BEAD funding by the simple act of claiming 100/20 Mbps speeds in the FCC maps while delivering something slower. People living in these areas are going to be left behind.
The problem is biggest for cellular wireless. These companies will admit that they can’t begin to serve everybody in an area – they have a natural upper limit on the folks they are willing to serve from a given tower – just like Starlink has done. In areas that are claimed to be served by fast cellular broadband, the majority of folks won’t be able to buy service from the only fast ISP.
My hope is that State Broadband offices look under the hood, on a case-by-case basis to find the real story. They ought to like folks like you, but should not be willing to give grants in areas where the ISP can’t deliver the claimed speeds to everybody.
Applendix A: Estimates from Broadband Analyst Mike Conlow
New version of the National Broadband Map
This version will be used for allocating funds in the NTIA’s BEAD program
The FCC released an updated National Broadband Map today and I’m ready to share the first version of a state-level analysis. This is the version of the map that will be used by the NTIA to allocate $42.5 billion in the Broadband Equity, Access, and Deployment (BEAD) program. I’ll provide the top lines here and more detailed methodology and caveats are below. Overall, as of December 31, 2022, there are 114,537,044 Broadband Serviceable Locations (BSLs) in the country (including territories). That’s a net addition of 1 million BSLs.
- 7.6% of the BSLs are Unserved, or 8.3 million nationally.
- 3.1% of the BSLs are Underserved, or 3.5 million nationally.
For California, that is 10,139,429 Broadband Serviceable Locations
- 3.2% of the BSLs are Unserved, or 317, 702 statewide
- 1.5% of the BSLs are Underserved, or 152, 091 statewide
Here’s the spreadsheet.
There are some surprises. Michigan, for example, lost 71,139 Unserved locations, an 18% decline, which leads to a $416 million lower allocation. (This deserves further investigation). North Dakota, Indiana, Florida, Georgia, and South Dakota also have double digit loses in the percentage of Unserved. (Lower Unserved numbers mean the maps show more locations as Served or Underserved, which lowers the allocation to the state).
In some states, the addition of Unserved locations is dramatic. Alaska’s Unserved locations grew 84% to 88,181 increasing their allocation to $166 million. There were a lot of other states with big increases: Nebraska (+225%), Iowa (+124%), Oregon (+70%), Kansas (+61%), and North Carolina (+45%).
(All of my comparisons to the previous National Broadband Map v1 are from the original data released by the FCC last November, with the exception of Illinois and Hawaii, which were updated. My understanding is, other than Illinois and Hawaii, the corrections to the v1 National Map have been minor.)
The big news is the projected allocation of the $42.5 billion. NTIA plans to release the allocations at the end of June, so it is more than likely that with the release of this data, the allocation levels are now set.
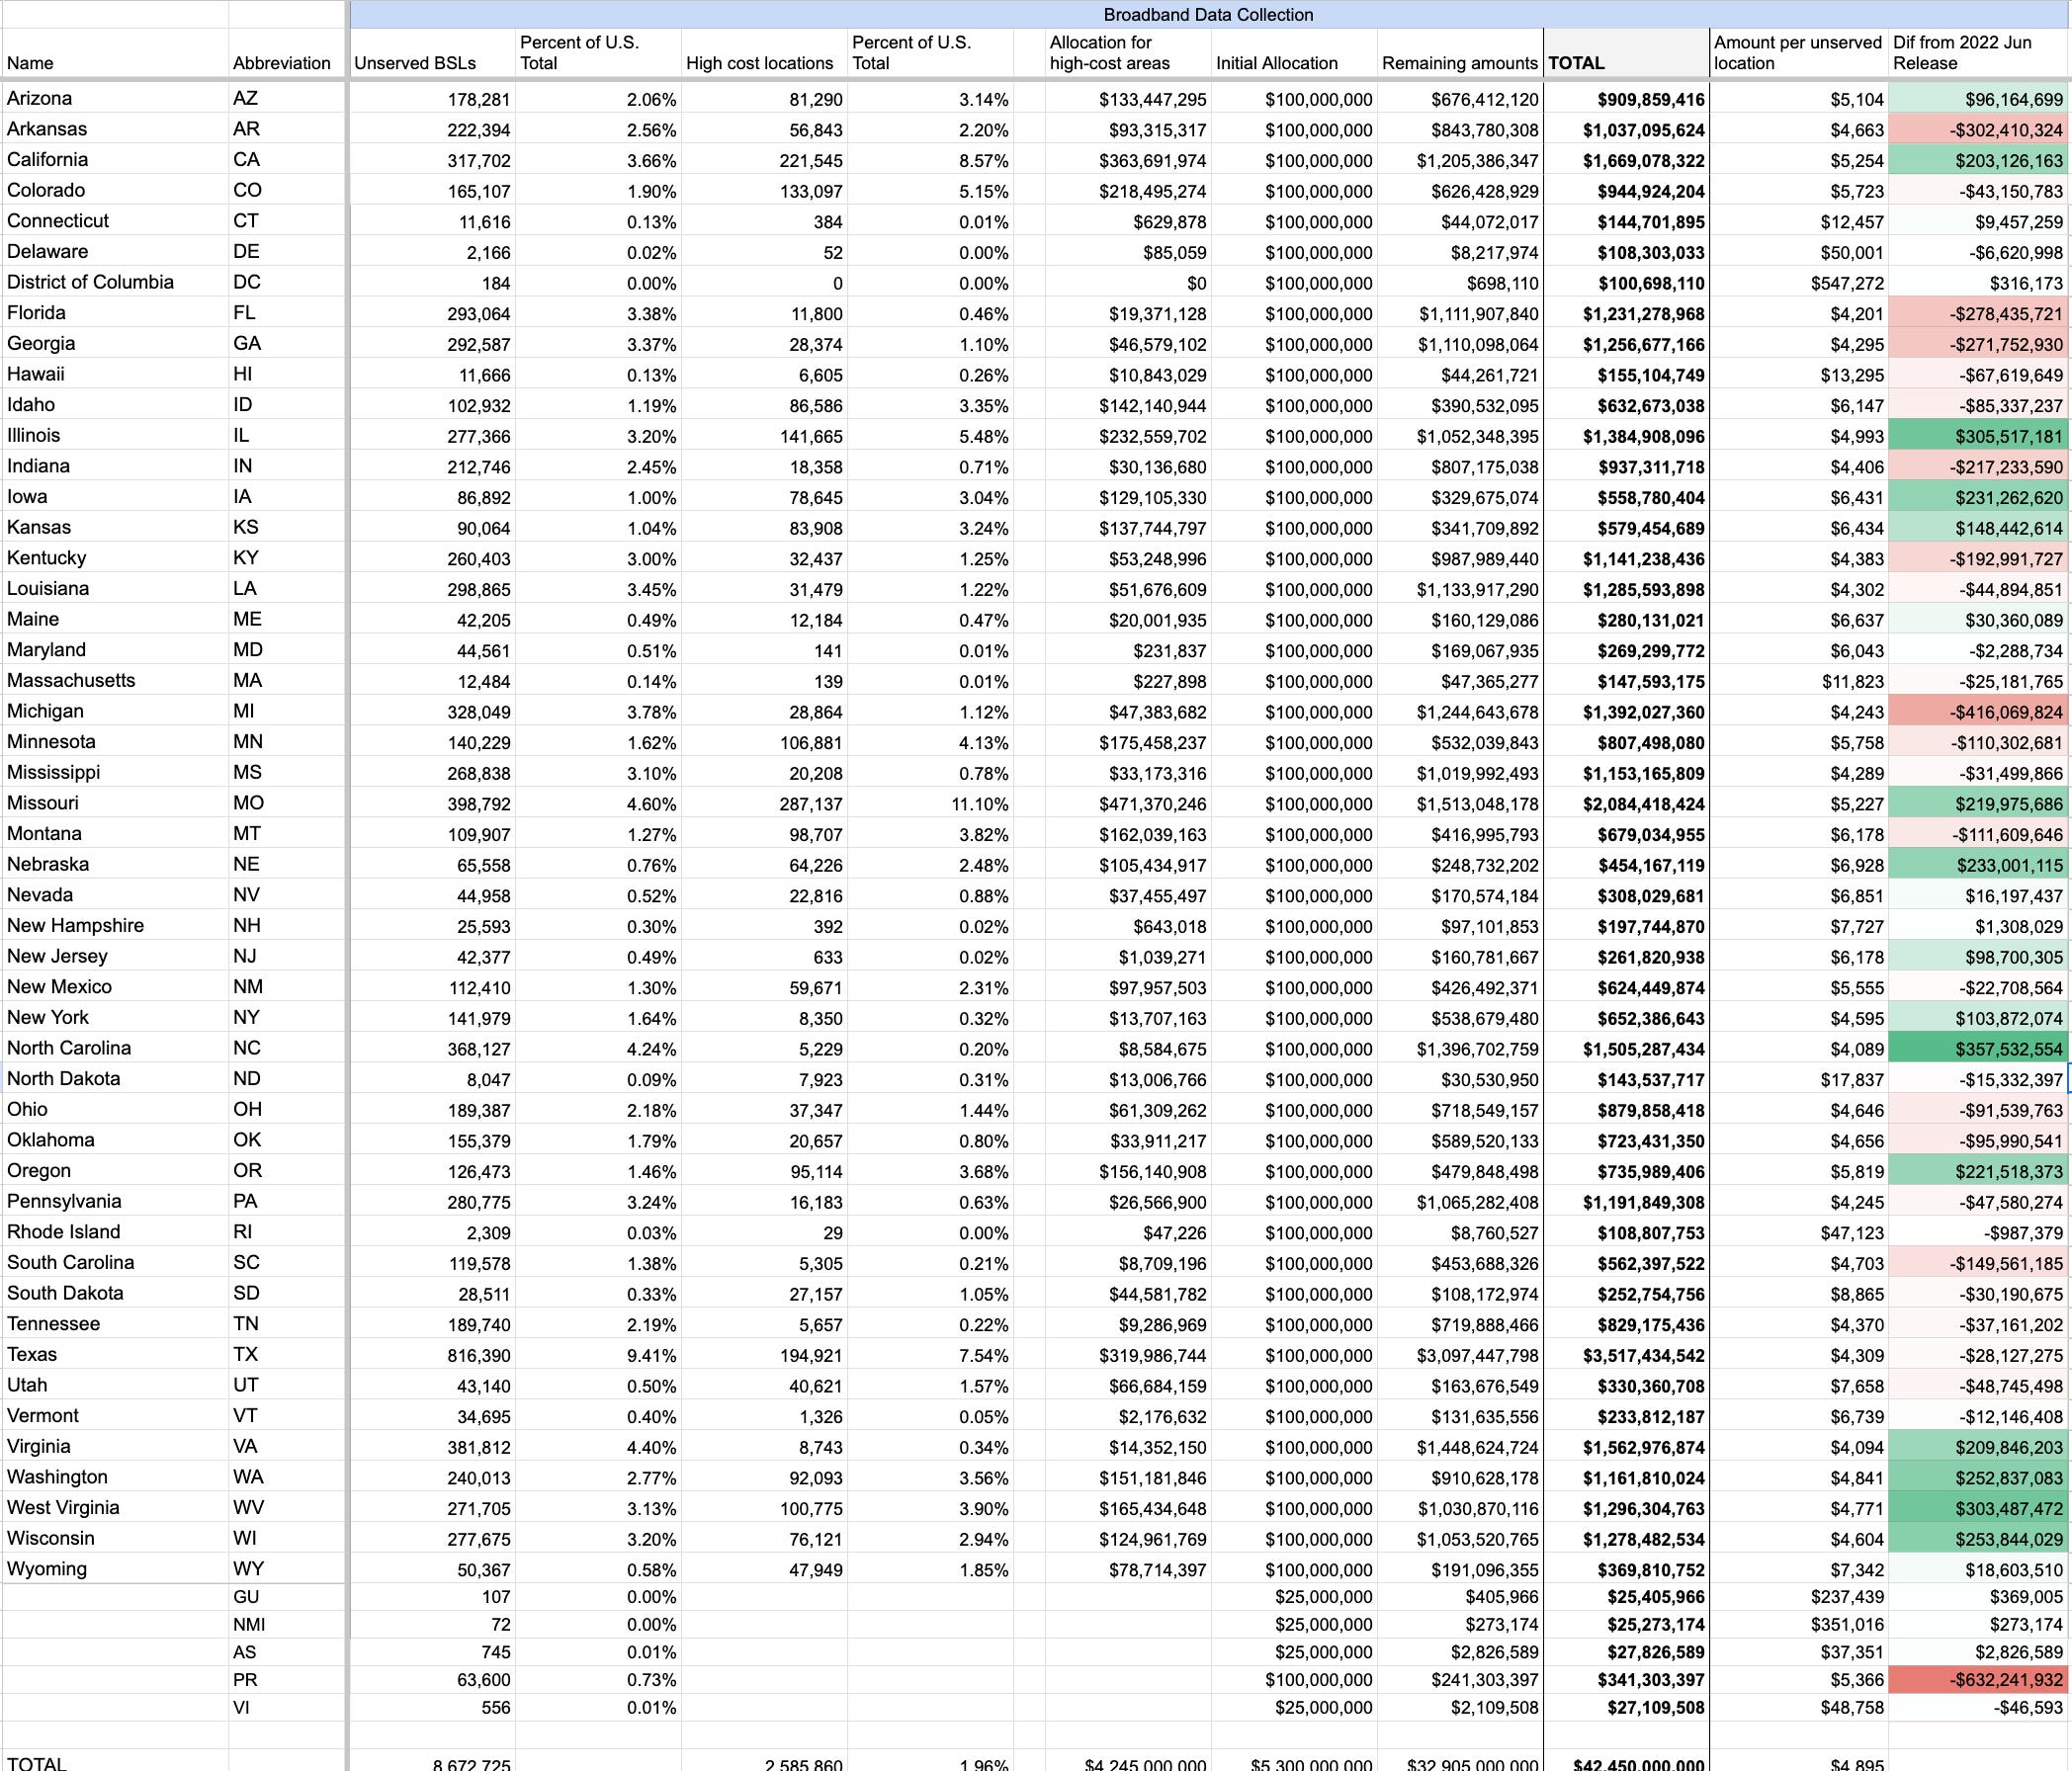
Ten percent of the overall allocation is based on the number of “high cost locations” in each state. To my knowledge, NTIA still hasn’t published how they plan to determine how many high cost locations each state has. As an estimate, I use numbers I generated in previous analysis that are themselves based on the reserve prices from the FCC’s RDOF reverse auction.
These allocation estimates include the territories, since that is how the allocation will be done by NTIA. However this allocation could undercount Unserved locations in the territories since the broadband coverage options are fewer. For example, in the previous release I had Puerto Rico with 213,000 Unserved out of 1.16 million BSLs. In this version, I get 63,600 Unserved out of 1.15 million BSLs. That leads to a minus $632 million swing for Puerto Rico (money that goes to other states). If the FCC releases authoritative numbers of BSLs and housing units in each Census block I’ll update these numbers.
If there are updates/changes/corrections to these numbers, I’ll post them as updates to this page or new posts.
I will have much more analysis on what’s changed since the first fabric release, and what this means for where things stand on broadband deployment in the future.
If you wish to cite these numbers, please do so as “estimates from broadband analyst Mike Conlow” and link to this Substack post. As always, if you want to reach me you can respond to the Substack emails and it will get to me.