Home | Vol 9 No 4 (2021):
Vol.9 Issue 4, April 2021
- Medical Research Archives
- Copyright 2021 KEI Journals. All Rights Reserved.
- Research Article, published Apr 12, 2021 | Read pdf here
- View: https://esmed.org/MRA/mra/article/view/2371
- Authors: Angela Tsiang and Magda Havas
- Affiliations:
- Angela Tsiang: None
- Magda Havas, PhD: Trent School of the Environment,Trent University,
Peterborough, ON, Canada, K9J 7B8
- Email: tsiangangela@gmail.com
- Accepted for Publication: Medical Research Archives, European Society of Medicine
- DOI: https://doi.org/10.18103/mra.v9i4.2371
Explanatory Note From the Editors of Wire California:
Wire-CA: At least since 2016, the U.S. public has been inundated with advertising, marketing and lobbying messages about the benefits of moving from the fourth generation of wireless (4G) to the much-hyped fifth generation of wireless (5G). The 5G propaganda machine can be traced to the oft-quoted, self-serving wireless industry-sponsored projections from this 2017 industry-sponsored white paper by Deloitte Consulting LLP (updated in 2018):
First, the white paper explains . . .
“This publication contains general information only and Deloitte is not, by means of this publication, rendering accounting, business, financial, investment, legal, tax, or other professional advice or services. This publication is not a substitute for such professional advice or services, nor should it be used as a basis for any decision or action that may affect your business . . . Deloitte shall not be responsible for any loss sustained by any person who relies on this publication.”
Then on page 1. . . we see the genesis of the false premise: “The Race to 5G”
“Since 2015, China outspent the United States by approximately $24 billion in wireless communications infrastructure and built 350,000 new sites, 1 while the United States built fewer than 30,000. 2 Looking forward, China’s five-year economic plan specifies $400 billion in 5G-related investment. 3 Consequently, China and other countries may be creating a 5G tsunami, making it near impossible to catch up.”
“Being first to 4G/LTE afforded the United States macroeconomic benefits as it became a test bed for innovative mobile, social, and streaming applications. Being first to 5G can have even greater and more sustained benefits to our national economy given the network effects associated with adding billions of devices to the 5G network, enabling machine-to-machine interactions and utilizing data from such interactions.
Well, the propaganda started right there on page 1:
- Of course, the US was not the first to 4G/LTE (that was Sweden)
- Also, China equipping their nation with a densified 4G/5G Wireless Grid for 24/7 surveillance and control of its population is not something to copy because such infrastructure is NOT consistent with American values for those who live in a nation with a government of the people, by the people, for the people — people who expect the preservation of freedom, privacy and the quiet enjoyment of streets (and homes).
- What else is not accurate in this “white paper” that drove many US Govt. policy decisions (and interlocking FCC Orders) from 2017 to 2019? Hint: a lot.
Scott Bergmann, VP, CTIA echoed the same themes to Congress in 2017 (9:15–13:55):
- “5G will add trillions of dollars to the economy and three million new jobs”
- “CTIA members have invested over 300 billion dollars over the last ten years and are responsible for more than 4.6 million jobs”
- “Wireless data traffic has increased more than 25 times since 2010 and is expected to increase by another five times by 2021”
- “America’s Wireless industry stands ready to invest another $275 billion to deliver 5G networks that will be faster, more responsive and connect more devices”
- “5G will unlock trillions of dollars of economic benefits and help save thousands of lives”
“The U.S. has been the global leader in 4G/LTE deployment and we’re poised to lead in 5G”
“The FCC can make targeted reforms and act on the additional 18 Gigahertz of spectrum identified in the Mobile Now Act”- “We must modernize our nation’s infrastructure siting policies so that Wireless networks can be deployed rapidly and efficiently”
- “Small cells are far less intrusive. The size of a pizza box or a lunch bock and will be deployed by the hundreds of thousands.”
A pizza box? Not even close.
The DC Circuit judges in Case No. 18-1129, Keetoowah et al. v FCC didn’t accept such puffery, either. It is in this propaganda-filled environment that the Wireless industry launched a “story” that “it needed” access to inexpensive real estate in the public rights-of-way (on wooden utility poles, metal light poles and other street furniture) — at the expense of local control, of course — because 5G millimeter wave (mmW) frequencies (those that are 30,000 MHz and above) “don’t travel very far down the street”. Well, not only is that not true, the industry, in October 2020, pretty much walked away from mmWaves to announce nationwide 5G based on repurposed 4G low-band frequencies (700 MHz to 2100 Mhz) and newly-leased licenses for mid-band frequencies (3500-3600 MHz) — so there is no actual need for any so-called “small cells”, at all.
A vast majority of the increased wireless service from 2017-2020 is from densified 4G/5G wireless infrastructure, emitting frequencies from 600 MHz to 2500 MHz. The authors of the following paper, Tsiang and Havas, analyzed COVID case and death data from counties and states with mmW 5G infrastructure because those counties and states would have the most frequencies in use for wireless communications and densified 4G/5G wireless infrastructure. After their paper was published, the BRAG™ Global EMF Monitoring project found that mmW cities have at least 3 times higher measured radiation levels (average power densities) in frequencies below 8 GHz than cities without mmW, which may be an additional reason why counties and states with mmW have higher rates of cases and deaths. Note that while the paper focusses on mmW, the mmW index is not only an indicator of mmW presence, but also of other wireless frequencies used in densified 4G/5G wireless infrastructure which is present in all mmW cities.
Therefore, the findings and conclusions from Tsiang and Havas in the paper, below, apply to RF Microwave Radiation currently transmitting from Wireless Telecommunications Facilities (WTFs) of any size or any “G”, including the current “alphabet soup” of confusing labels that the wireless industry “markets” to the public about wireless services on frequencies ranging from 600 MHz to more than 60,000 MHz — labels such as
- 4G
- 4G-LTE (LTE = Long Term Evolutuion)
- 4G-LTE Advanced (even more features added to 4G as recently as 2017-2018)
- 5G-E (disingenuously relabeling Advanced 4G-LTE as 5G Evolution)
- Verizon’s Ultra Wideband 5G (actual mmW service at 28,000 and 39,000 MHz)
- Verizon’s Nationwide 5G (a relabeling of certain 4G frequencies from 700 MHz to 2100 MHz, supplemented by newly-leased licenses for 3500-3600 MHz)
Confused yet? In the words of T-Mobile criticizing Verizon in this video:
“Verizon Ultra Wideband 5G is available 0.6% of the time. Verizon nationwide 5G has nowhere near 25x faster speeds. Confused? That’s the way Verizon likes it.”
As one can read here, “AT&T Will Put a Fake 5G Logo on 4G LTE phones”
According to FierceWireless, AT&T will display an icon reading “5G-E” on newer phones that are connected to LTE in markets where the carrier has deployed a handful of speed boosting — but still definitively 4G — technologies. The “E,” displayed smaller than the rest of the logo, refers to “5G Evolution,” the carrier’s term for networks that aren’t quite 5G but are still faster than traditional LTE.
Where is the Federal Trade Commission, the Agency That is Supposed to Police Such Deceptive Advertising?
Of course, in March, 20020, we warned the San Francisco Board of Appeals and Dr. Tomás Aragón , the then Director of the SF-DPH — who, in Jan 2021, was promoted to be the Director of the CA-DPH — about such negative health consequences from so-called “small” Wireless Telecommunications Facilities (sWTFs) that were installed without federally-mandated National Environmental Policy review (NEPA review) as close as 6-12 feet from second- and third-story bedroom windows in San Francisco:
Note: In the paper that follows, the mmW index is not only an indicator of mmW presence, but also of densified 4G/5G wireless infrastructure which is present in all mmW cities. In addition, a recent finding was made by the BRAG Global EMF Monitoring project that mmW cities have at least 3 times higher radiation levels (average power densities) than cities without mmW, which may be an additional reason why counties and states with mmW have higher rates of cases and deaths.
Abstract
COVID-19-attributed case and death rates for the U.S.A. were analyzed through May 2020 in three ways . . .
- for all 50 states,
- for the country’s largest counties, and
- for the largest counties in California
. . . and found the COVID-19 case and death rates to be statistically significantly higher for states and counties with compared to those without 5G millimeter wave (mmW) technology. 5G mmW index was a statistically significant factor for the higher case and death rates in all three analyses, while population density, air quality and latitude were significant for only one or two of the analyses.
For states with 5G mmW vs. states without:
- cases per million were 79% higher (p = 0.012),
- deaths per million were 94% higher (p = 0.049),
For counties with 5G mmW vs. counties without:
- cases per million were 87% higher (p = 0.005) and
- deaths per million were 165% higher (p = 0.012)
While higher population density contributed to the higher mean case and death rates in the 5G mmW states and counties, exposure to 5G mmW had about the same impact as higher population density in 5G mmW states on mean case and death rates.
5G mmW had about three times as much impact as higher population density for 5G mmW counties on mean case and death rates.
Based on multiple linear regression, if there was no 5G mmW exposure, case and death rates would be 18-30% lower for 5G mmW states and 39-57% lower for 5G mmW counties.
This assessment clearly shows exposure to 5G mmW technology is statistically significantly associated with higher COVID-19 case and death rates in the U.S.A. The mechanism — should this be a causal relationship. — may relate to changes in blood chemistry, oxidative stress, an impaired immune response, an altered cardiovascular and/or a neurological response.
Full Text
1. Introduction
The first documented case of COVID-19 was reported in Wuhan, China in December 2019. To prevent its spread, the U.S. blocked travel from China on January 31st and declared a National Emergency on March 13th, 2020. After the World Health Organization (WHO) declared it a pandemic on March 19, 2020, the U.S. began quarantine and stay-at-home orders to slow the virus’ spread and to “flatten the curve”. Despite these precautions, the virus spread quickly in the U.S. and around the globe.
The infectious agent was named severe acute respiratory syndrome coronavirus 2 (SARS-CoV-2) due to genetic similarity to SARS-CoV that caused a pandemic in 2002-4. The disease associated with SARS-CoV-2 is COVID-19, which is an abbreviation for Coronavirus Disease 2019 associated with SARS-CoV-2.
According to the U.S. Centers for Disease Control the epidemiological triangle for infectious diseases consists of the agent, the host and the environment. While attention has focused on the agent (genetics, modes of infection, etc.) and the host (age and comorbidities), little attention has focused on key environmental factors. These include but are not limited to air quality since this was initially identified as a respiratory illness, population density for person to person transmission, and electromagnetic radiation since COVID-19 appeared after 5G was implemented and many of the COVID-19 symptoms resemble those of microwave sickness.
As of September 18, 2020, according to Johns Hopkins University, the cases are not uniformly distributed globally (Figure 1). Many factors may account for this: testing differences, per capita income, standard of health care, population demographics, and environmental factors among others. This paper focuses on four environmental factors that may relate to the spread and fatality of this disease: population density, air pollution, latitude (which determines potential endogenous vitamin D production) and presence of 5G mmW technology, which is present in combination with frequencies used in previous generations of wireless communications from 1G to 4G and does not replace them. These data, along with COVID-19 case and death data, were readily available for the United States.
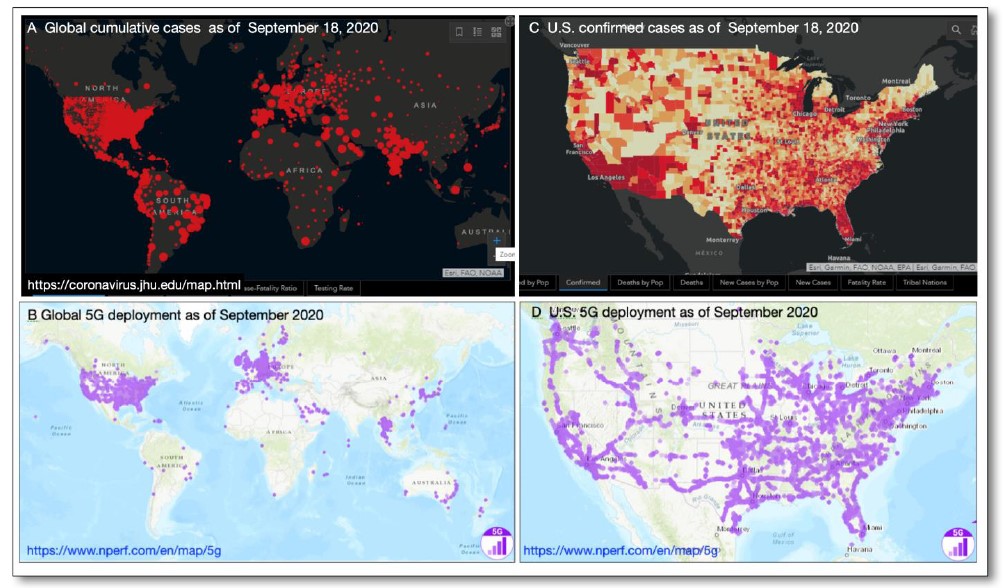
Figure 1. Data for COVID-19 (as of September 18, 2020) and rollout of 5G as of September 2020.
As of August 9, 2020, the U.S. was #1 out of 213 nations in the world for the highest number of total COVID-19 cases at 5.2 million, with 15,698 cases per million (9th highest) and 500 deaths per million (10th highest) [1].
The rollout of 5G technology is to support the Internet of things (IoT). As of January 2020, 31 countries had working 5G networks globally [2-5] In the top quartile of the highest ranking countries for COVID-19 deaths per million, 16 of them had working 5G networks; while only 7 countries had 5G in the 2nd highest quartile; 6 in the 3rd highest quartile and only 2 in the bottom quartile. In the top quartile, the 5G countries with higher deaths per million than the U.S. were San Marino (1238), Belgium (851), U.K. (686), Spain (610) and Italy (582). The other countries with 5G in the top quartile with fewer deaths per million than the U.S. were Ireland (358), Switzerland (229), South Africa (175), Romania (140), Germany (110), Denmark (106), Monaco (102), Oman (100), Bahrain (95), and Saudi Arabia (91).
Three radio frequency bands are used in 5th Generation (5G) wireless communications. The low band refers to frequencies below 1 GHz; the mid band to frequencies between 1 GHz and 6 GHz, and the high band to the millimeter waves (mmW), which are 24 GHz and above. The U.S. telecommunication companies began using mmW for 5G wireless communications in 2019 after their acquisition of the mmW spectrum, making the U.S. the first country in the world to use mmW for 5G. In June 2019, FCC’s Auction 101 for 28 GHz sold for $700 million and Auction 102 for 24 GHz sold for $2 billion [6], and in March 2020, 37, 39 and 47 GHz bands in Auction 103 sold for $7.5 billion [7], generating a total of $10 billion for the U.S. government. As of February 2020, European countries were still not using mmW for 5G [8], and other countries have used only the low and mid band frequencies for 5G. To achieve higher speeds for 5G, densification of antennas has occurred worldwide. Also, because mmW have shorter wavelengths (higher frequencies) than that used for 1G to 4G, they are more susceptible to interference from obstructions, thus requiring more transmitters closer to users, which have been added to streetlamps and utility poles in some cities. The shorter distance and higher density of mmW antennas translates into higher radiation exposures, as acknowledged by the FCC’s 2019 Notice of Proposed Rulemaking 19-126 [9] to increase the current RF exposure limits four-fold to accommodate 5G mmW devices and infrastructure. If environmental exposure to 5G mmW increases the severity of COVID-19 or other viral infections, then the rapid rollout of 5G technology should be reconsidered.
2. Methods
2.1 COVID-19 Attributed Cases and Deaths
Data for number of cases, deaths, and tests for COVID-19 from Worldometer was assessed on April 22, 2020, May 15, 2020, and May 31, 2020 [1]. Data collection was stopped on May 31, 2020 because the nationwide quarantine effectively ended by that time as people in major cities all around the country broke quarantine when they gathered in crowds and some states began lifting their stay-at-home orders.
2.2 Variables: Air Quality Index, Latitude, Population Density and mmW Index
A mmW exposure index was calculated based on the sum of the total population of the cities serviced by mmW 5G by each provider in a county or state, divided by the total population of that county or state. This factor is not a calculation of the mmW exposure level but a differentiation between the different exposure levels in each state and county based on the number of mmW providers and the number of mmW cities and their population in those counties or states, which is necessary for statistical analysis.
Population density data were obtained from Wikipedia, which are calculated from population data from the U.S. Census divided by the area of the state or county. Air Quality Index (AQI) data from 2019 from the EPA were included in the analysis for states and counties. Latitude, which may relate to potential production of endogenous vitamin D associated with sun exposure, was also included in the analysis for counties.
2.3 States and Counties with and without 5G mmW Networks
Cities with 5G mmW networks were chosen for analysis because the most frequencies for wireless communications (5G mmW plus low and mid band 5G as well as frequencies from previous generations 1G to 4G) and the highest RF exposures due to the increased number of small cell antennas for 5G and their placement close to users would be present there. Even though urbanization and high density may be part of the criteria for choosing where to locate 5G mmW, and therefore it may seem appropriate to adjust the case and death rate data for urbanization and density, it is actually NOT appropriate to do so for this analysis. The higher the urbanization and density in an area, the higher the levels of RF radiation present because of the higher density of cell phone towers, Wi-Fi hot spots, cell phones and Wi-Fi routers present in highly urbanized or dense areas. To adjust the data for urbanization and density would therefore remove the effect of higher levels of RF radiation present in highly urbanized or dense areas. Therefore, case and death rate data and charts were not adjusted for density or urbanization. However, multi-variate analysis was done to determine if urbanization or density, along with AQI and latitude, were statistically significant factors in the case and death rates using multiple linear regression, and then their contributions relative to the contribution from 5G mmW to the case and death rates were calculated.
Counties and states with mmW 5G service were determined from the websites of the wireless providers AT&T [10], T-Mobile [11], and Verizon [12] which specified the cities that they service with mmW 5G (Table 1). There were no changes in the cities using mmW for 5G between April 22 and May 31, 2020.
The data were analyzed three ways to determine robustness: at the state level, at the county level, and for the largest counties in California.
In this analysis, 32 states were using mmW 5G and 18 states were not. All counties using mmW for 5G were included except for Hampton Roads, VA, because it spanned a combination of 16 counties and cities which made its analysis difficult; so, a total of 53 counties using mmW 5G were used.
The counties not using non-mmW were from the largest 120 cities in the U.S. according to the U.S. Census Bureau. After omitting the counties that contained cities with mmW 5G service, 49 counties were left that did not have mmW 5G technology. There are thousands of counties in the U.S., and because only the ones containing the 120 largest cities were included, some states were not represented in the county analysis. The states not represented in the county analysis (but included in the state analysis) are: VA, CT, DE, ME, MS, MT, NH, ND, RI, SC, VT, WY.
California, the most populated state in the U.S., has 60 counties in total and six counties with 5G mmW technology. The counties that did not use 5G mmW technology chosen for comparison included only those with a population of 500,000 or greater, of which there were 11.
Pearson’s correlations were calculated for the case and death rates with the four variables population density, mmW index, AQI, and latitude. Two-sample t-test was used to compare case and death rates of 5G mmW states and counties to that of non-5G mmW states and counties, and statistical significance was defined to be p <0.05 with alpha = 0.05. Regression analyses were performed to find regression equations for the case and death rates and identify statistically significant variables at p < 0.05. The numbers of cases per test and deaths per test were analyzed at the state level but not at the county level due to missing data.
3. Results
3.1 U.S. Compared to European Countries
Whereas none of the European countries was using mmW for 5G as of February 2020 and mmW spectrum was not even assigned to any European country except Italy [8], the U.S. began using mmW for 5G in 2019. Of the 10 European countries (with populations greater than 2 million) with the highest numbers of COVID-19 deaths per million through August 9, 2020 [1], deaths per million were significantly higher for those countries with 5G compared to non-5G and this difference was statistically significant (617 vs. 383, p = 0.026) (Table 2).
Table 1. Cities with mmW 5G Coverage and Provider from April 22 to May 31, 2020. Source: AT&T [10], T-Mobile [11], Verizon [12].
Table 2. Top 10 Ranking European Countries for COVID-19 Deaths/Million for 5G * vs. Without 5G through August 9, 2020. Source: Worldometer [1]
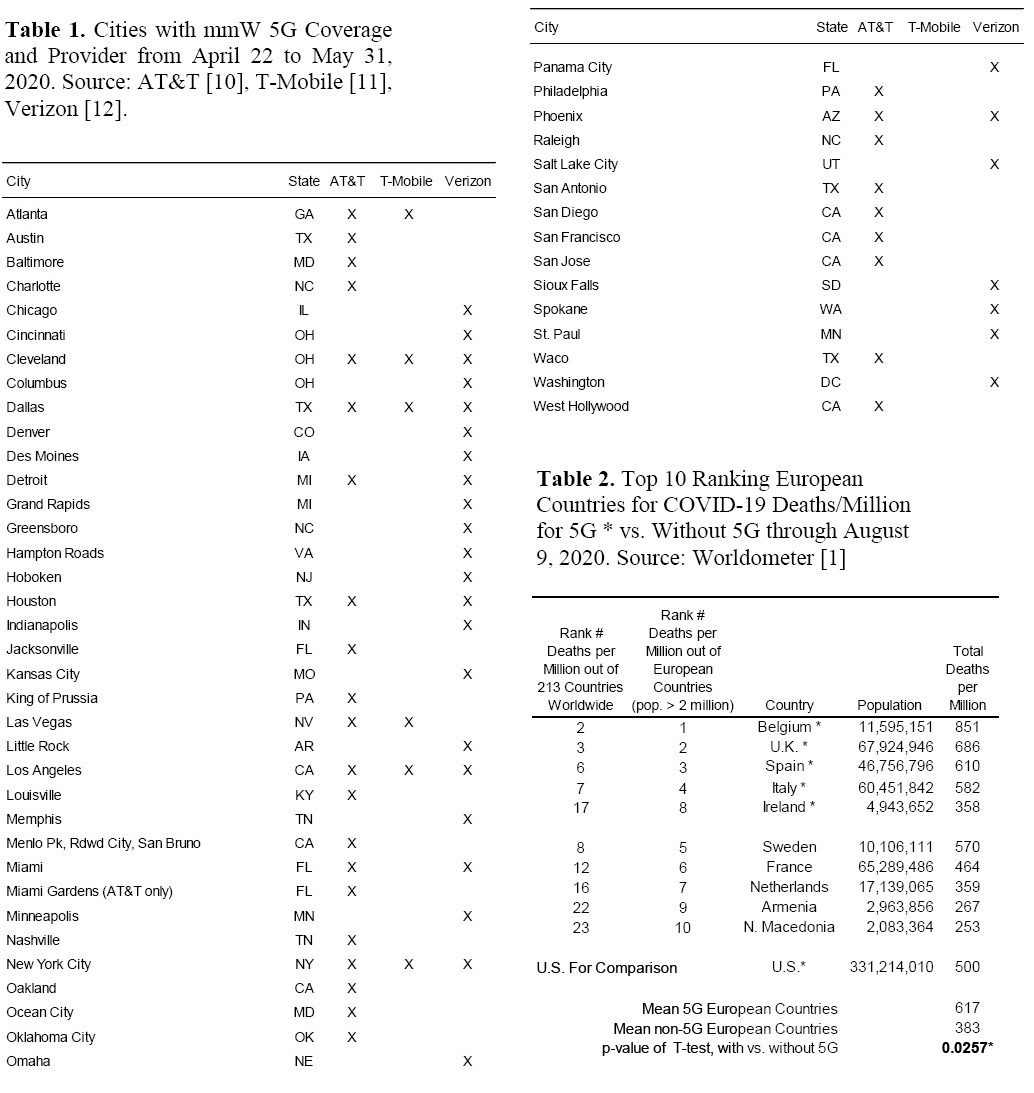
The 500 deaths per million for the U.S. are within the range of the 5G European countries. Because of differences in testing and criteria for how cases are counted between U.S. and European countries, deaths per million is the most consistent number to use for comparison between countries. However, there are still other differences between the U.S. and European countries – per capita income, standard of health care, population demographics, quarantine measures, and environmental factors like air pollution – that complicate comparison between countries. Nevertheless, these data are provided to show how the U.S. compares to the top 10 European countries with the highest deaths per million, with and without 5G.
3.2 States with vs. without 5G mmW
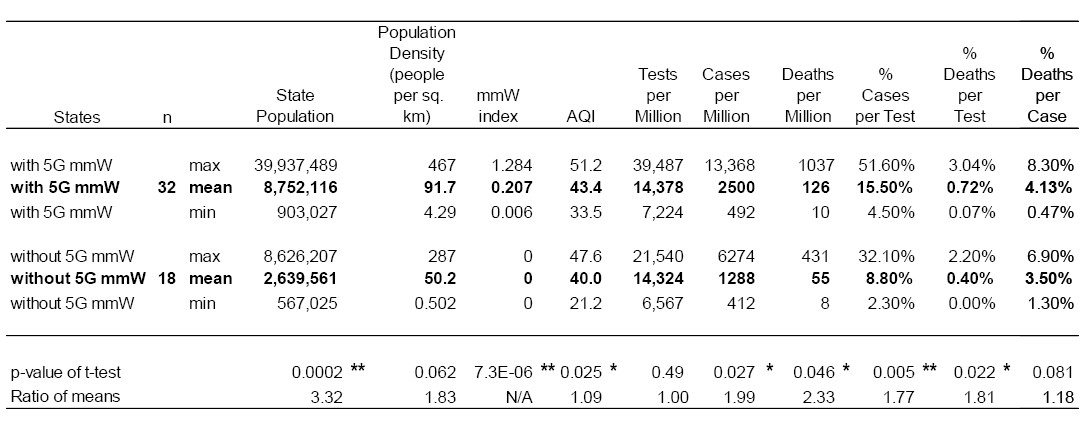
There were 32 states with 5G mmW and 18 states without 5G mmW. Descriptive statistics for the cumulative data through April 22, which was just after the peak of daily deaths for COVID-19 had occurred on April 21 (Figure 2), can be found in Table 3. The average rate of cases and deaths was much higher for the mmW states compared to the non mmW states, and these differences were statistically significant with p-values between 0.005 to 0. 046 (Table 3 and Table 4A). There were almost twice as many cases per million (2,500 vs. 1,288, ratio 1.94) and more than twice as many deaths per million (126 vs. 55, ratio 2.29) for states with vs. without mmW technology. For mmW states compared to the non-mmW states, there were almost twice as many cases/test (15.5% vs. 8.82%, ratio 1.76) and twice as many deaths/test (0.721% vs. 0.364%, ratio 1.98). The fatality rate (deaths per case) was higher for the mmW states but was not statistically significant (4.13% vs. 3.50%, ratio 1.18, p = 0.081).
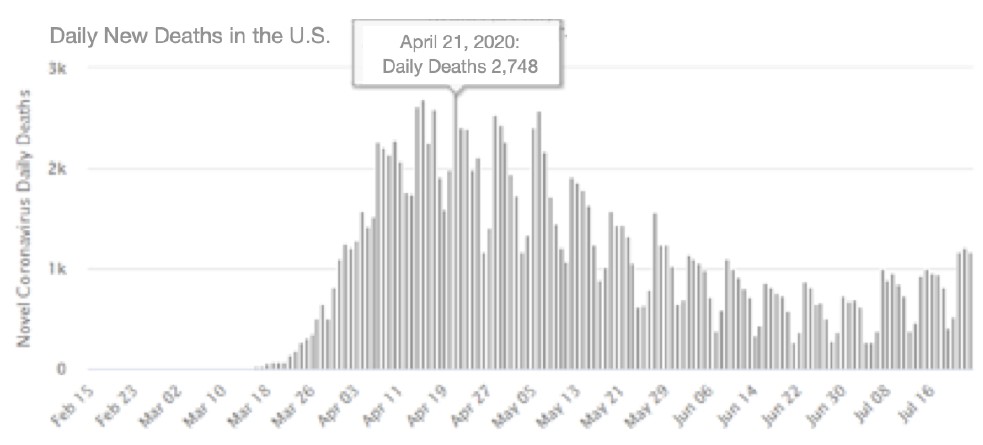
Figure 2. COVID-19 daily new deaths peaked at 2,748 on April 21, 2020 in the U.S. Source: Worldometer [1]
Table 3. Descriptive statistics through April 22, 2020 (after peak of daily deaths occurred) for states with and without 5G mmW for population, mmW index, COVID-19 tests, air quality index (AQI), and number of COVID-19 attributed cases and deaths. Statistical significance is indicated by * (p < 0.05) and ** (p < 0.01).
Data from May 15 and May 31 show the same pattern as for April 22, with statistically significant higher cases/million, deaths/million, cases/test, and deaths/test for the mmW states compared to the non mmW states. For data cumulative through May 31, 2020, comparing mmW to non-mmW states, there were 5776 vs. 3220 cases per million (ratio 1.79, p = 0.012); 307 vs. 158 deaths per million (ratio 1.95, p = 0.049); 9.88% vs. 5.88% cases per test (ratio 1.68, p = 0.003); and 0.494% vs. 0.270% deaths per test (ratio 1.83, p = 0.025) (Table 4B & C; Figure 3A & B; Figure 4A & B).
Table 4. Case and death rates attributed to COVID-19 and Pearson’s Correlations for population density, mmW index and their interaction for U.S. states for cumulative data through (A) April 22, 2020; (B) May 15, 2020; and (C) May 31, 2020. Statistical significance is indicated by * (p < 0.05) and ** (p < 0.01). NOTE: YTD is year to date.*
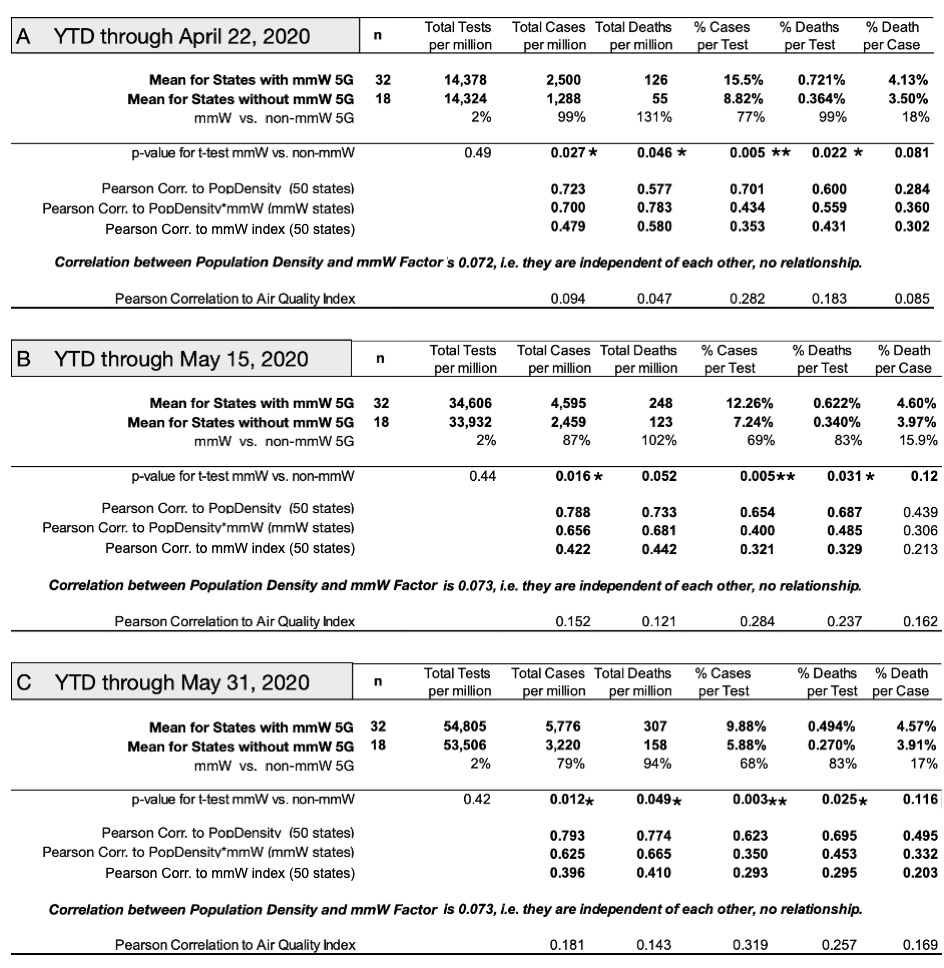
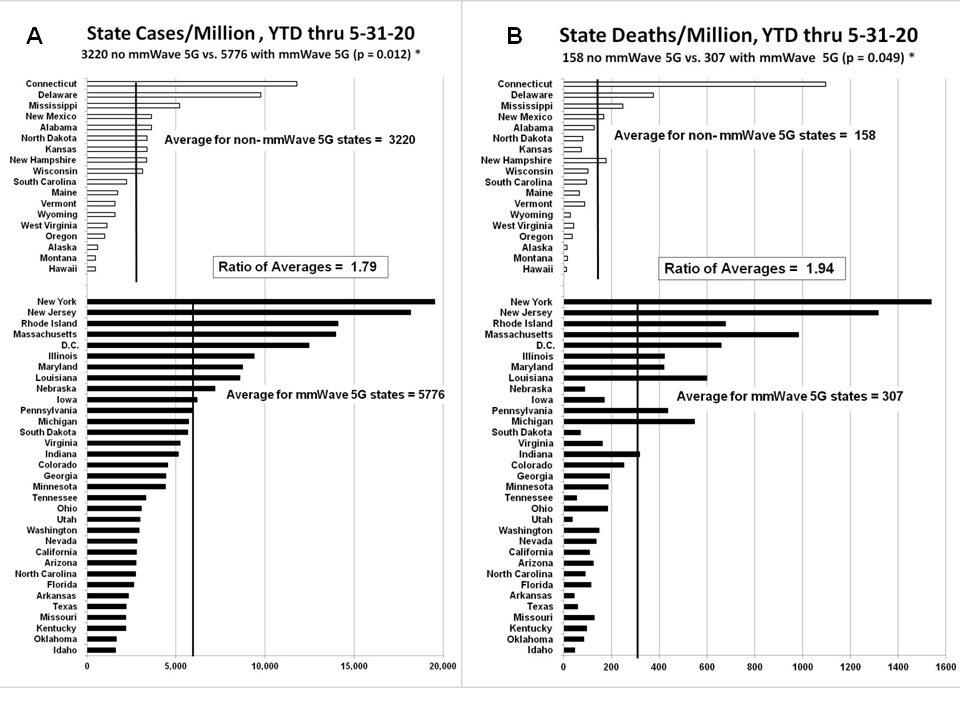
Figure 3. COVID-19 attributed case/million (A) and deaths/million (B) for states with and without 5G mmW for data through May 31, 2020.
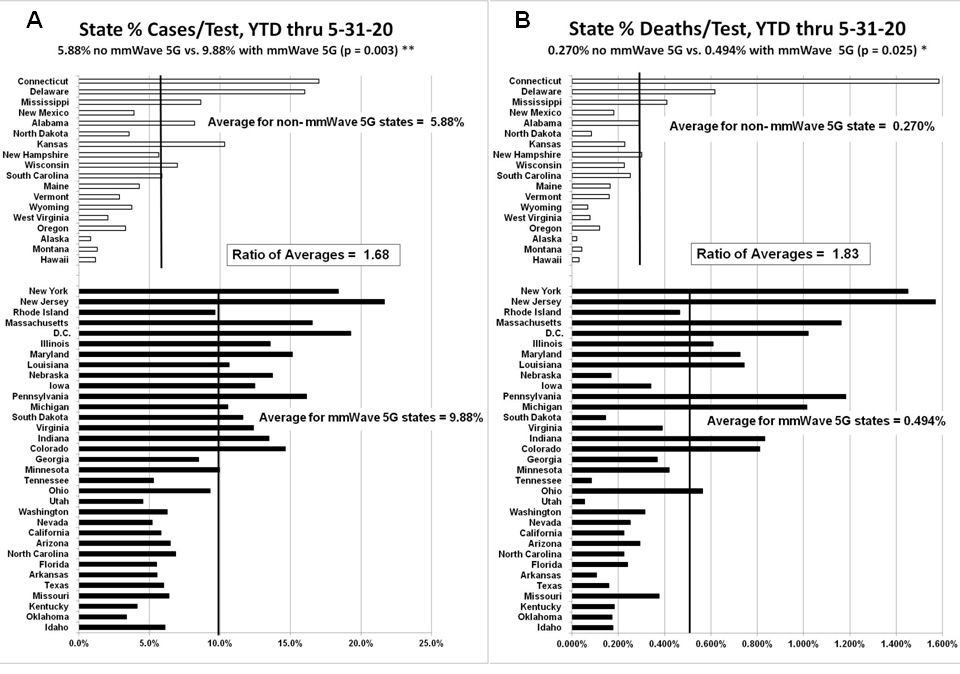
Figure 4. Percentage of COVID-19 attributed cases/test (A) and deaths/test (B) for states with and without 5G mmW technology for data through May 31, 2020. Note: different scale.
3.3 Counties with vs. without 5G mmW
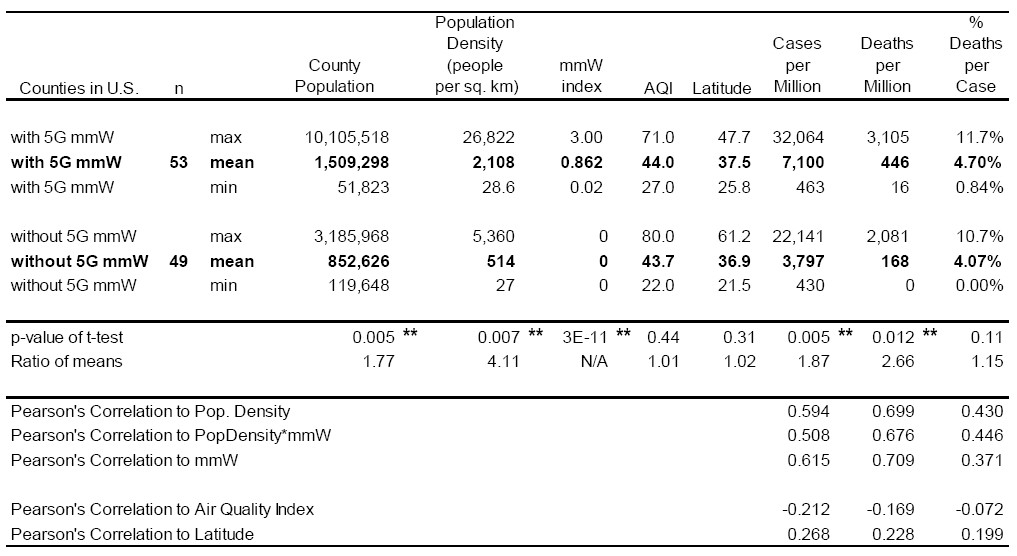
Data for 53 counties with 5G mmW and 49 counties without 5G mmW were analyzed. Comparing mmW to non-mmW counties, there were 7100 vs. 3797 cases per million (ratio 1.87, p = 0.005) and 446 vs. 168 deaths per million (ratio 2.65, p = 0.012), and these differences were statistically significant. The fatality rate, which is deaths/cases, was higher for the mmW counties (4.70% vs. 4.07%, ratio 1.15), but this difference was not statistically significant (Table 5; Figures 5A and 5B).
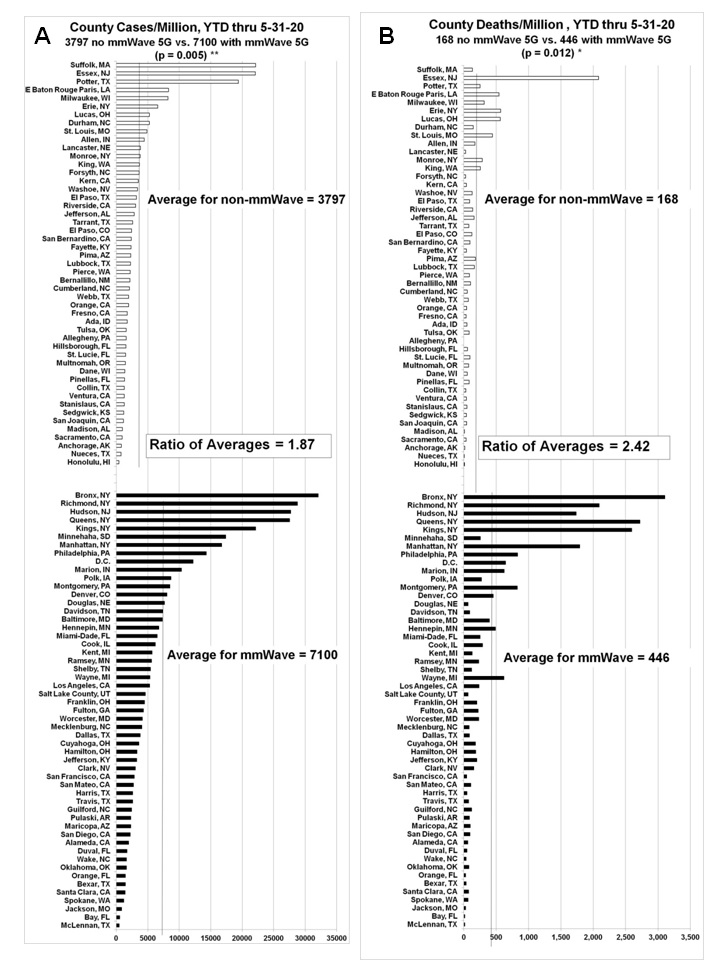
Figure 5. COVID-19 attributed cases/million (A) and deaths/million (B) for counties with and without 5G mmW technology through May 31, 2020. Note: different scale.
Table 5. Descriptive statistics and Pearson’s Correlations for U.S. counties through May 31, 2020 with and without 5G mmW for population, population density, mmW index, air quality index (AQI), latitude and number of COVID-19 attributed case and death rates. Statistical significance is indicated by * (p < 0.05) and ** (p < 0.01).
3.4 California Counties with vs. without 5G mmW
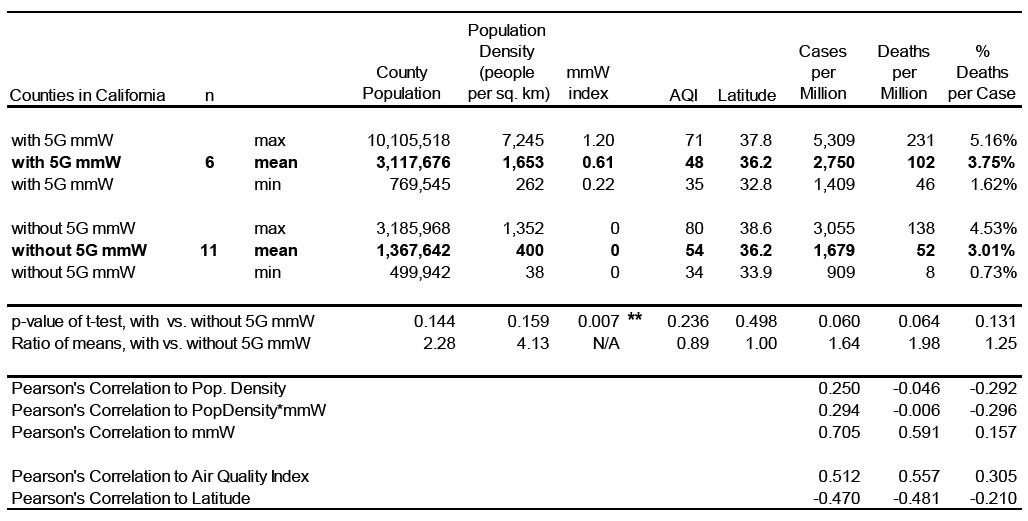
Data for six counties with 5G mmW and 11 counties with a population of 500,000 or greater without 5G mmW in California were analyzed. The six counties with 5G mmW technology were San Francisco, Los Angeles, San Diego, Alameda, Santa Clara, and San Mateo. The 11 counties that did not have 5G mmW technology were Orange, San Bernardino, Contra Costa, Sacramento, Riverside, Kern, Fresno, Ventura, San Joaquin, Stanslaus, and Sonoma. The mmW counties had higher average cases per million (2750 vs. 1679, ratio 1.64, p = 0.06) and significantly higher average deaths per million (102 vs. 52, ratio 1.96, p = 0.064 and higher fatality rate (3.75% vs. 3.01%, ratio 1.25, p = 0.131) than that of the non-mmW counties (Table 6).
3.5 Pearson’s Correlations
A Pearson’s correlation coefficient assesses the relationship between two variables. The correlation coefficient is considered very strong between +0.7 and +1; strong between ± 0.5 and ± 0.7, and moderate between ± 0.3 and ± 0.49.
Pearson’s correlations of cases/million, deaths/million, cases/test, and deaths/test to air quality index, latitude population density, and mmW index were calculated. The results are in Table 4 for states, Table 5 for counties, and Table 6 for California.
Table 6. Descriptive statistics and Pearson’s Correlations for California counties through May 31, 2020 with and without 5G mmW for population, population density, mmW index, air quality index (AQI), latitude and number of COVID-19 attributed case and death rates. Statistical significance is indicated by * (p < 0.05) and ** (p < 0.01).
3.5.1 Correlations of Case and Death Rates with Population Density
Population density is strongly correlated with the rates of cases/million, cases/test and deaths/million, and deaths/test in the 50 states (r =0.60 to 0.79 for April through May) (Table 4). Population density is an indicator of person to person contact as well as the amount of wireless radiation exposure. For example, in New York City, many reside in multi-level apartment buildings where they are exposed to many Wi-Fi routers and other wireless devices from close by neighbors. In addition, Wi-Fi routers from certain providers have public Wi-Fi hot spots that provide service to other customers. These hot spots give off enough radiation to wirelessly connect anyone within a 100 meter radius [13]. Those living in an apartment complex in the middle of a large urban city are likely to be exposed to more Wi-Fi hotspots than those living in single family homes in the suburbs. So even though population density is a major factor in transmission, higher population density also inherently means higher wireless radiation exposure from neighbors (Table 4 for state data and Table 5 for county data). At the county level, population density was also found to be strongly correlated with the case and death rates. Pearson’s correlations between cases/million and population density was 0.594, between deaths/million and population density was 0.699, and between deaths/cases and population density was moderate, at 0.43 (Table 5). These correlations for population density are comparable to those reported in other studies. A study [14] found a Pearson’s correlation of 0.6 for public transit to COVID-19 cases per million, and a 0.5 correlation for population density to COVID-19 cases per million. A Brazilian study reported a negative correlation between COVID-19 cases and temperature (r = -0.38) and a positive relationship between COVID-19 cases and population density (r = 0.51) [15].
3.5.2 Correlations of Case and Death Rates with Millimeter Wave Exposure
The mmW index is moderately to strongly correlated with cases per million, cases per test, deaths per million, and deaths per test for the 50 states. For cumulative data through April 22, 2020, the Pearson’s correlations with the mmW index for the cases/million (r = 0.479) and deaths/million (r = 0.580) were the highest of the correlations from the data from April and May. From April to May, the same correlations trended downward slightly, but multiple linear regression with cumulative data through May 31, 2020 determined that mmW index was a statistically significant factor in the case and death rates, which is discussed later. The correlation between population density and mmW index is very low at 0.072, meaning that population density and mmW index are not correlated to each other, and that a high mmW index area is not necessarily a high density area. This is important, because it means that the higher rates of cases and deaths in mmW states are not solely because of the higher population density that may be present in those states. At the county level, mmW exposure was also found to be strongly correlated with the case and death rates. Pearson’s correlation for the mmW index and for cases/million was 0.615, for deaths/million it was 0.709, and for deaths/cases it was a moderate 0.371 (Table 5). For California counties, there were strong correlations between the mmW exposure index and cases per million (r = 0.705) and deaths per million (r = 0.591), There were strong correlations also for the air quality index (AQI) and the cases (r = 0.512) and deaths (r = 0.557) per million (Table 6). However, population density and latitude were not well correlated with the cases and deaths per million for California counties.
3.5.3 Synergy between Population Density with mmW Exposure
There was a positive interaction between population density and the mmW index acting together that was greater than the effect of population density or mmW acting singularly on the deaths per million in the cumulative data through April 22. This is because the interaction of population density with mmW index (PopDensity*mmW) had a higher correlation (0.783) to deaths/million (Table 4A) than either the correlation of population density (0.577) or mmW index (0.580) alone did with deaths/million, meaning that the combined action of population density with mmW index had a stronger effect on deaths/million than either population density or mmW index did singularly. 3.5.4 Correlations of Case and Death Rates with Latitude and Vitamin D.
Latitude is an indicator of potential sun exposure and vitamin D production. As latitude increases, the intensity of the radiation from the sun decreases, which reduces endogenous vitamin D production. Higher latitudes have been found to be partially associated with increased COVID-19 mortality rates [16]. Low vitamin D levels have been found to be a risk factor for the COVID-19 complications, which will be discussed later. Latitude was found to have a weak correlation with the case and death rates (0.199 to 0.268 in Table 5), however, based on regression analysis, which will be discussed later, latitude was a statistically significant factor in the case and death rates.
3.5.5 Correlations of Case and Death Rates with Air Quality Index (AQI)
AQI was found to have very little to weak correlation with the case and death rates in the state and county analysis for the U.S. For the states, the correlations ranged from 0.047 to 0.319 (Tables 4A–C), and at the county level, the correlations ranged from -0.212 to -0.072 (Table 5). For California counties, air quality was strongly correlated with the cases per million and deaths per million (r = 0.512 and r = 0.557 respectively, Table 6), and air quality was a statistically significant factor for the cases per million and deaths per million (p = 0.0016 and p = 0.0031 respectively, Table 7)
Air quality does have an impact on respiratory diseases. AQI ranges from 0-500, and air is considered unhealthy above 100, very unhealthy from 201-300, and hazardous at 301-500. The average AQI data for all states was between 21.2 to 51.2, indicating relatively clean air, which may be why AQI did not show up as a significant factor at the state level. Furthermore, the AQI used was a yearly average and not live data, and during the lockdowns emissions from cars and industry were significantly reduced, which likely made the actual air quality that people were exposed to better than the AQI data used.
3.6 Multi-Variate Analysis shows Population Density, Latitude, mmW Index are Statistically Significant Factors in the Case and Death Rates
According to multiple linear regression, at the state level, population density and mmW index were statistically significant contributors to the rates of cases and deaths; urbanization was found to not be a statistically significant factor compared to population density and mmW index. At the county level, population density, mmW index, and latitude were statistically significant contributors to the rates of cases and deaths. For California counties, only the AQI and mmW index were statistically significant contributors (p<0.01) to the case and death rates. For case and death rates, the p-values for population density were between 1.02E-13 to 0.0064 for mmW states and counties; the p-values for mmW index were between 5.00E-06 to 0.026 for mmW states, counties, and California counties; the p-values for latitude were 0.014 and 0.045 for mmW counties; the p-values for AQI were 0.0016 and 0.0031 for California counties (Table 7). All regression equations and the p-values for density, mmW index, AQI, latitude are given in Table 7.
Multi-variate analysis using multiple linear regression showed the higher mean population density in the mmW states and counties is not the main reason for their higher case and death rates, that mmW index has at least as great an impact as the higher density. At the state level, the contribution of the mmW index is about the same as that from the higher density, but at the county level, the contribution from mmW index is at least three times higher than that from density (Table 8).
The regression equation for state cases/million (Table 7) is: Cases/million = 1418 + 32.54 state density + 7100 mmW index, with an adjusted R2 of 0.732 , which means that 73.2% of the variation in cases/million is explained by the state population density and the mmW index, and the adjusted R2 measures how close the data are to the fitted regression line. Both the state population density and the mmW index are statistically significant contributors to the cases/million (p < 0.01 for both, Table 7), and the regression equation is statistically significant with p-value = 1.35E-14, which is much less than p < 0.01 (Table 7). The increase in state population density between average mmW state and average non-mmW state is 91.7-50.2 = 41.5 (Table 3). So, the contribution to the mean case/million for mmW states from its higher average population density = 32.54*41.5 = 1350 (Table 8). The increase in mmW index between average mmW state and average non-mmW state is = 0.207 – 0 = 0.207 (Table 3). So, the contribution to the mean cases/million for mmW states from its mmW exposure index = 7100 * 0.207 = 1470 (Table 8). Therefore, the contribution to the mean cases/million for mmW states from mmW exposure is almost the same, but slightly higher than it is from the higher population density (1470 vs. 1350 out of the 5776 actual cases/million (Table 8). Thus, the higher mean cases/million for the mmW states is due to the higher average population density AND the mmW exposure of those states, with the contribution from each being about the same.
The regression equations also predict what the case and death rates would be if there was no mmW exposure. For example, the mean cases/million of the mmW states is 5776 cases/million; however, if there was no mmW in these states, the same regression equation predicts that the mean cases/million would be 24% lower, at 4403 cases/million (Table 8).
For all of the case and death rates for states, counties, and California, the contributions from the higher population density and from the mmW exposure of the mmW states and counties are given in Table 8, as well as what the predicted case and death rates would be if there was no mmW exposure.
Table 7. Regression Equations for data cumulative through May 31, 2020. Statistical significance is indicated by * (p < 0.05) and ** (p < 0.01).
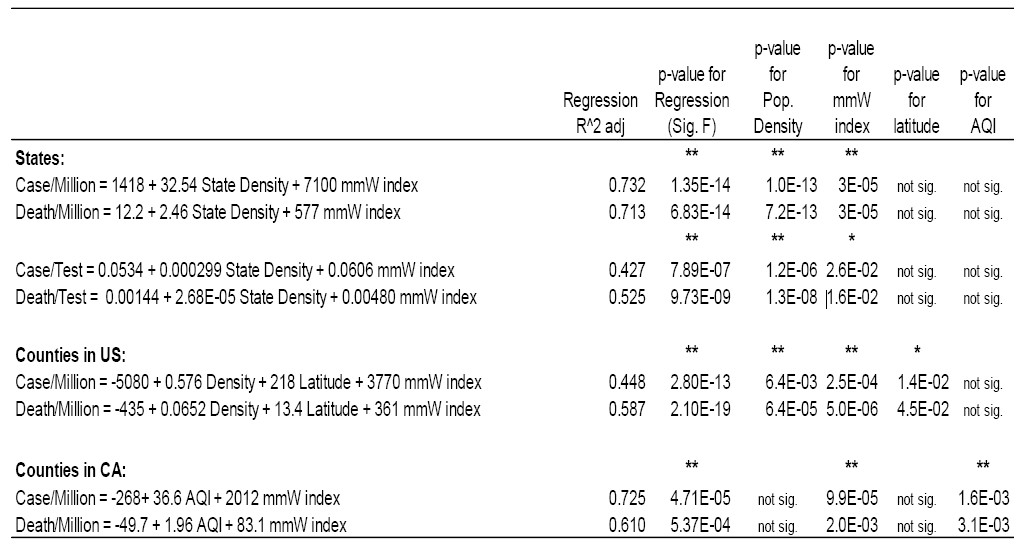
Table 8. Predicted Values and Contributions from mmW index and higher mean density for mmW state or county for data cumulative through May 31, 2020.
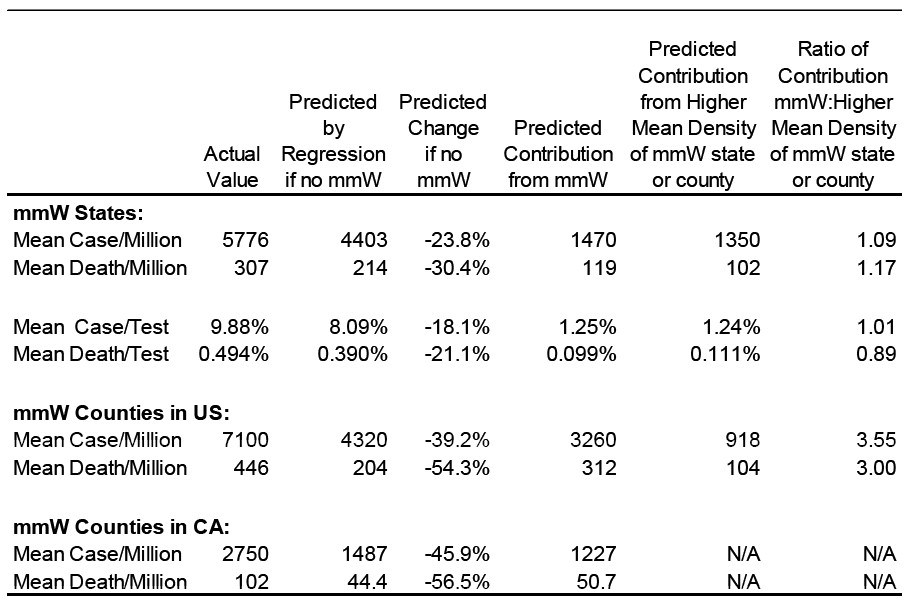
Figure 6 shows that the mmW exposure factor is better correlated than the population density with the case and death rates, and this is also seen in the higher R2 for the mmW exposure factor. For the cases/million, the R2 was 0.501 for the mmW exposure as a predictor compared to the R2 of 0.363 for population density, and for the deaths/million, the R2 was 0.632 for the mmW exposure as a predictor compared to the R2 of 0.526 for population density.
These R2 for COVID-19 case and death rate regressions as a function of mmW exposure, population density, and latitude are better than those found by others. In New York a positive correlation between COVID-19 cases per million and population density was R2 = 0.17, p < 0.01, and between cases per million and public transportation commute ratios, R2 = 0.25, p < 0.01 [17].
4. Discussion
The world changed in March 2020 after the WHO classified COVID-19 as a pandemic and as countries closed their borders and initiated social distancing. Admittance to hospital intensive care units (ICU) reached an all-time high in some places and elderly patients were moved to nursing homes, where residents and staff quickly developed fatal symptoms of COVID-19.
Ventilators, commonly used for respiratory ailments, were not as effective as expected and doctors around the world were sharing their concerns about treatment protocols that were not working. Atypical cardiovascular complications were also being reported, including blood clots, hypoxia, arrhythmia, lower hemoglobin levels and strokes even in younger patients [18-19].
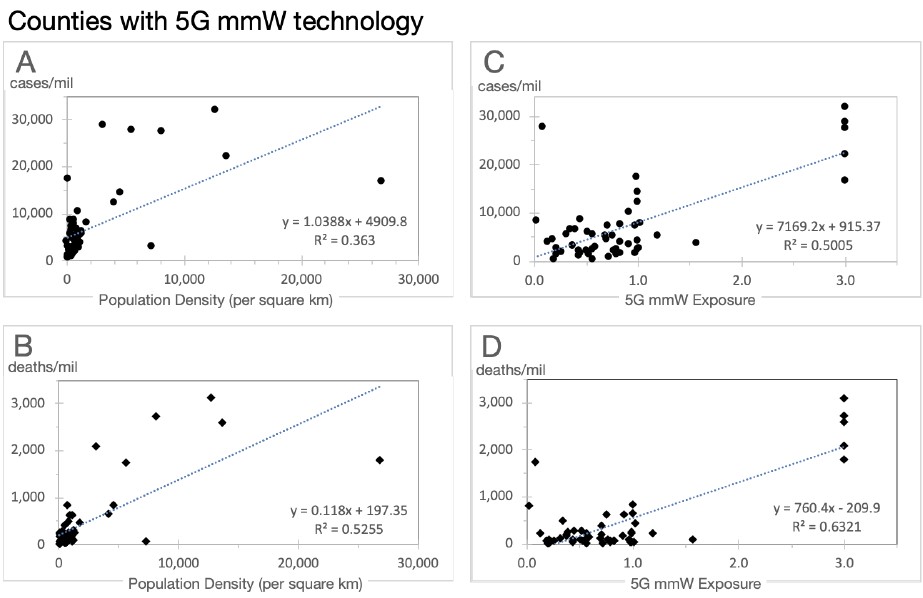
Figure 6. Regression plot for 53 counties with 5G mmW technology for COVID-19 attributed cases/million and deaths/million as a function of population density (A & B) and as a function of 5G mmW exposure (C & D) through May 31, 2020.
COVID-19 was clearly different than previous viral respiratory illnesses, and one theory was proffered that COVID-19 may be associated with the rollout of 5G mmW technology, which had occurred just prior to the first cases of COVID-19 in China [20].
Our results show a statistically significant increase between the COVID-19 attributed cases and deaths in states and counties in the U.S. with vs. without 5G mmW technology. States with 5G mmW technology had excess cases and excess deaths per million when compared to states without this technology, which was the case for three different dates: April 22, May 15 and May 30. When we examined U.S. counties, to determine how robust this relationship was, we got the same trend.
Multiple linear regression and Pearson’s correlation coefficients have shown that the mmW index was statistically significant to the case and death rates in the analyses for states, counties, and California counties, i.e., in all three analyses, while population density was statistically significant for two of the analyses, and air quality index and latitude were statistically significant for only one of the analyses.
4.1 COVID-19 Anomalies and Wireless Radiation
There are some unique anomalies in COVID-19 that distinguish it from other viral infections. These anomalies are multiple blood clots that form in organs and blood vessels, severe inflammation, hypoxia and hypoxemia, and skin lesions even in those who test negative for SARS-CoV-2 (suggesting that their symptoms may be due to something other than SARS-CoV-2), and symptoms lingering for months after initial onset of the infection that resemble microwave sickness symptoms. The interesting thing about these anomalies are that RF exposure can exacerbate all of them.
Some COVID-19 patients report they have been sick for many months, despite testing negative for the SARS-CoV-2 virus, with numerous symptoms of microwave sickness. Microwave sickness, which the World Health Organization refers to as idiopathic environmental intolerance attributable to electromagnetic fields (IEI-EMF), is the medical term for the syndrome of symptoms that result from chronic exposure to non-ionizing radiation. It is also referred to as electromagnetic sensitivity per the Americans with Disabilities Act (ADA) or electrohypersensitivity (EHS) in some scientific studies. However, electromagnetic illness (EMI) is perhaps a more appropriate term since RFR exposure has the potential to affect all humans and not only those who are highly sensitive to this radiation. Most of the symptoms that these long COVID-19 patients have in common with microwave sickness are headaches, fatigue, difficulty concentrating, memory problems, insomnia, cardiovascular abnormalities like palpitations and tachycardia, tinnitus, anxiety, depression, and skin lesions according to a COVID-19 Survey Report by Indiana University School of Medicine [21]. At least 24 of the long COVID symptoms reported in the survey are also symptoms of microwave sickness, aka EHS [22] (Figure 7).
Wireless radiation is a toxic substance that degrades the immune system, and “[e]xposure to myriad toxic substances degrades the immune system, whose dysfunction is then exploited by SARS-CoV-2 to result in COVID-19,” [23]. A recent Russian study found a strong correlation between a country’s exposure limits for RF radiation and COVID-19 deaths per million (r=0.577) and deaths per cases (r=0.551) [24].
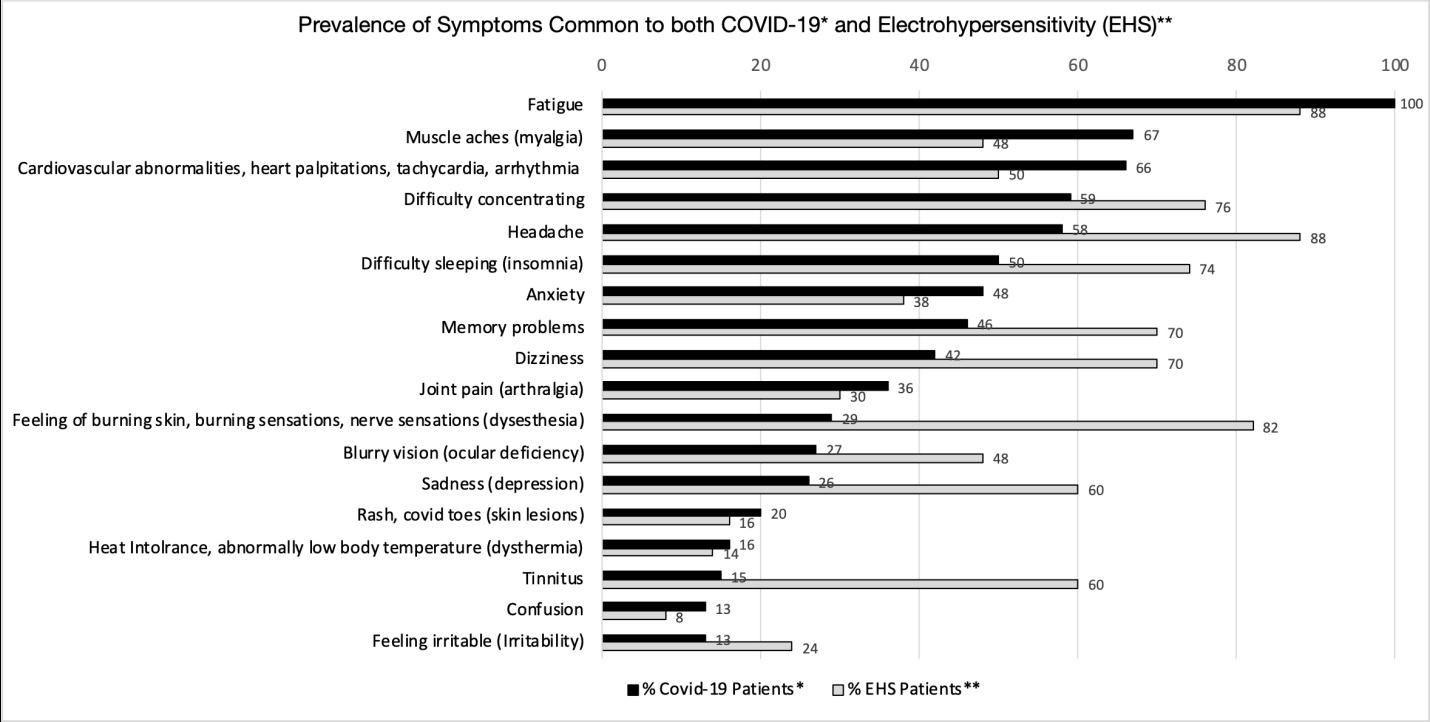
*Figure 7. Prevalence of symptoms common to both COVID-19 and Electrohypersensitivity (EHS). Sources: *[21], *[22]
4.2 Common Mechanisms of Harm and Synergistic Effects between RF Radiation and COVID-19
Radio-frequency radiation (RFR) shares some mechanisms of harm with SARS-CoV-2 which could act synergistically with SARS-CoV-2 to promote and prolong infection. As explained below: (1) RFR impairs the immune system which would contribute to a greater number of people becoming infected and dying from disease [25-28]; (2) RFR is known to increase free-radicals and contribute to oxidative stress, leading to increased inflammation [29-33]; (3) RFR affects the blood, heart, and autonomic nervous system resulting in some combination of hypoxia, tachycardia, arrhythmia, rouleaux formation, and sympathetic up-regulation [34-36]; (4) RFR interferes with the body’s repair mechanisms [37-39]; and (5) a growing population (between 1% – 10%) in developed countries is unable to tolerate current levels of RFR [40-41], developing symptoms of microwave sickness that are similar to those reported for long COVID-19 (Figure 7).
Microwave sickness is triggered by our increasing exposure to RFR emitted by mobile and cordless phones, cell phone base stations, radar, broadcast antennas, Wi-Fi, Bluetooth, smart meters, smart appliances, smart homes, smart light bulbs, wireless security systems, wireless personal assistants, wireless baby monitors, and wireless wearables, and now an increasing number of people are also exposed to 5G mmW.
Higher radiation exposures result from the shorter distance to people and higher density of antennas for 5G mmW. This is acknowledged by the FCC proposal in December 2019 to increase the current exposure limits four-fold to accommodate 5G mmW devices and infrastructure. The current exposure limit for the general population of 1000 μW/cm2 averaged over a 30-minute period has been the guideline since 1996 per FCC 47 CFR Ch. I § 1.1310 and the FCC has proposed to increase that to 4000 μW/cm2 indefinitely in its 2019 FCC Notice of Proposed Rulemaking 19-126 [9].
5G mmW have not been tested for their long-term biological effects and there is growing concern from the scientific and medical communities that this technology could have adverse biological consequences. Studies suggest that mmW can contribute to ocular damage, arrhythmias, antibiotic resistance among bacteria, teratogenic effects in drosophila, and impaired immunity in mice [42]. Even though mmW are absorbed mostly in the skin, systemic signaling in the skin from mmW can result in physiological effects on the nervous, cardiovascular and immune systems mediated through neuroendocrine mechanisms [42]. A compendium of 3800 studies showing a myriad of harmful biological effects from RFR at non-thermal levels (and below FCC’s exposure limits) are contained in the 2012 BioInitiative Report [43].
4.3 Wireless Radiation affects the Immune System, increases Oxidative Stress and Inflammation
There is a common presumption that mmW are safer than the lower frequencies used in 4G and previous generations of wireless communications because mmW are mostly absorbed in the skin. However, biological responses to mmW irradiation can be initiated within the skin, and the subsequent systemic signaling in the skin can result in physiological effects on the nervous system, heart, and immune system [44]. The cities with 5G mmW would have the most varied and highest potential RF exposure levels because 5G mmW requires the use of multiple small cells in close proximity to users and all three bands of frequencies for 5G, in addition to radiation from previous generations of wireless communications.
Additionally, severe inflammation has been reported in COVID-19 cases, and oxidative stress is a cause of inflammation [45]. There are many studies showing that wireless radiation causes oxidative stress and generates free radicals [29-33, 46-48]. A review by an expert committee appointed by the Swiss government found that RF-EMF increased oxidative stress which can lead to changes in oxidative balance, and that those with pre-existing conditions (immune deficiencies or diseases such as diabetes and neurodegenerative diseases) that compromise the body’s defense mechanisms (including antioxidative protection) can experience more severe health effects from EMF exposure; also, young and elderly individuals can react less efficiently to oxidative stress induced by EMF [49]. So chronic RF exposure creates oxidative stress and oxidative stress leads to inflammation. RF exposure has also been shown to directly increase inflammation by the production of pro-inflammatory cytokines that cause the immune system to overreact [50].
There are many studies showing the effect of wireless radiation on the immune system [27, 43]. A 2013 review found that wireless radiation has a stimulating effect on the immune system initially with short-term exposure, and an immunosuppressive effect with chronic exposure [26]. Cell phone radiation exposure for 1 hour per day for 30 days compromised the immune system of rats, resulting in a significant decrease in immunoglobulin levels, total leukocyte, lymphocyte, eosinophil and basophil counts; and a significant increase in neutrophil and monocyte counts [51]. Shielding from EMFs was found to significantly improve immune function and decrease inflammation in humans; lymphocyte NK (natural killer) cell activity increased by 30% after EMF exposure was reduced for two months [52]. In 2015, a significant discovery was made that the brain was directly connected to the immune system by lymphatic vessels [53], which would mean that the immune system can be affected directly by the brain and environmental influences that affect the brain, such as wireless radiation. A U.S. government study under the National Institute of Health found that cell phone radiation can affect the brain by increasing glucose metabolism in the brain [54] .
4.4 Wireless affects Vitamin D and Vitamin D Receptor
Vitamin D is essential to the proper functioning of the immune system. Low vitamin D levels have been associated with the most severe symptoms of COVID-19. Patients with low vitamin D are twice as likely to experience major complications from COVID-19 [55]. Another study found that 85% of severe COVID-19 patients had vitamin D insufficiency, and that 100% of ICU patients less than 75 years old had vitamin D insufficiency [56]. The case fatality rate of COVID-19 was highest in European countries with the highest incidence of severe vitamin D deficiency, and supplementation with vitamin D may reduce COVID-19 mortality [16].
Vitamin D deficiency can result from inflammation caused by chronic wireless radiation exposure [40]. Vitamin D supplementation was also found to reverse the negative effects of cell phone radiation on the immune system of rats [41]. Wireless radiation also lowers vitamin D receptor (VDR) activity by changing the shape of the VDR, thus impairing VDR activity and its ability to bind with vitamin D [28]. This is important because when a T-lymphocyte is exposed to a foreign pathogen, it extends a VDR to search for vitamin D, and if there is insufficient vitamin D, T-lymphocytes will not activate to destroy the invading pathogens [57].
4.5 Wireless Radiation depletes Glutathione which reduces Vitamin D and promotes Infection
There’s evidence that low endogenous glutathione production has led to complications in COVID-19 and that low glutathione levels reduce vitamin D levels [58]. Vitamin D was also found to correlate positively with glutathione levels in type II diabetic patients [59], who have an increased risk for COVID-19 complications. Glutathione treatment of patients with COVID-19 pneumonia successfully prevented the cytokine storm in COVID-19 patients [60]. Several studies have shown reduced glutathione production from wireless radiation exposure. Glutathione was found to be at statistically significant lower levels in those living close to a cell tower (within 80 m) exposed to 100 times higher RF radiation compared to those living far from a cell tower (300 m or more) [37]. Another study found that radar workers in the military who had been working with radar for over 10 years had less than 50% of glutathione levels of non-radar workers, and this lower level was statistically significant [30].
4.6 Wireless Radiation lowers Oxygen Intake and damages Mitochondria
RF exposure also affects the structure of hemoglobin, reducing its ability to bind to oxygen. After just two hours of exposure to cell phone radiation, human hemoglobin structure changed, decreasing its affinity to bind to oxygen in the lungs between 11-12% [34] which reduces the amount of oxygen that would be carried from the lungs to the body’s tissues, contributing to hypoxia. This is important because SARS CoV-2’s ability to infect cells is enhanced when blood oxygen levels decline. The “furin cleavage” sequence in the virus activates increased ACE2 receptor attack and cellular invasion in low oxygen environments [61]. RF radiation also affects the electron transport chain in mitochondria. Mitochondria supply the energy in cells and consume the majority of oxygen in the cell. RF exposure leads to mitochondrial dysfunction, leading to lowered oxygen consumption in the cell and less energy production, which would cause fatigue. Wireless sources of EMF causing extensive electron leakage from the mitochondrial electron transport chain was attributed as the main cause of EMF damage in human reproductive cells, and wireless EMF exposure increased production of reactive oxygen species (ROS) by mitochondria [32].
4.7 Wireless Radiation promotes Blood Clotting
Vitamin D also has an anticoagulant effect, and low vitamin D levels have been shown to increase the chance of venous blood clots [62].
Formation of blood clots leading to strokes and other complications have been reported in COVID-19 cases in the young and middle-aged with no risk factors for clotting. In children, a condition associated with COVID-19 known as Multisystem Inflammatory Syndrome in Children (MIS-C) with symptoms including “COVID Toes” involves inflammation of the blood vessels and the formation of blood clots.
RF exposure can cause red blood cells to clump and stick together, known as rouleaux formation [35-36] (Figure 8). As early as 1978, effects of mmW on blood were found to cause a “tendency toward hypercoagulation” at an exposure of 1000 μW/cm2 or less [63]; 1000 μW/cm2 for 30 minutes is the current exposure limit for mmW for the public in the U.S. Electromagnetic fields were found to increase the risk for blood clot formation [64]. Other studies have also shown changes in blood viscosity and rouleaux formation with frequencies of 2 kHz [65]. Frequencies in the 0-3 kHz range are found in wireless communications in the form of pulsation and modulation, and there is significant evidence that the biological effects from wireless communications is because of these electric fields; in addition, the application of pulsed electromagnetic fields (PEMF) for short periods of time have therapeutic effects [44] such as the stimulation of bone growth [66]. The right modulation in pulsating electrostatic field therapy can reduce rouleaux formation [67]. Electromagnetic fields have been used for over a hundred years therapeutically, and PEMF devices, approved by the FDA, have been used in animals and humans to reduce inflammation, increase circulation and reduce pain [68]. The fact that RF radiation at non-thermal levels is used in medical therapy means that there are biological effects of RF radiation at non-thermal levels. In addition, mmW are used in medical therapy, including cancer therapy. At power density levels far exceeding the FCC permissible levels for wireless communications of 1000 μW/cm2, mmW have been used to stimulate immune cell activity suppressed by anti-cancer drugs [69-70]. Chronic RF radiation exposure within the FCC permissible levels disturbs immune function through stimulation of various allergic and inflammatory responses; for example, RFR increases mast cells in the skin, morphologically alters immune cells, and interferes with tissue repair processes [25]. Anti-inflammatory effects of mmW, achieved only with specific modulation frequencies for certain mmW carrier frequencies, have been used therapeutically also; but without the correct modulation frequency, certain carrier mmW frequencies were “ineffective” [71]. Therefore, it is not just the mmW carrier frequency, but also its combination with pulsation and modulation frequencies that determine biological effects. Medical therapy using RF and mmW radiation is achieved only under controlled conditions, with specific carrier and pulsation and modulation frequencies at specific power densities over a specific and relatively short period of time. The RF radiation that we are exposed to from wireless communications is constant and random, with varying power densities, layered with many frequencies from different sources that use pulsation and modulation frequencies needed to enable wireless communications without consideration of biological effects. Consequently, medical mmW and telecommunication mmW have very different biological impacts due to different exposure parameters.
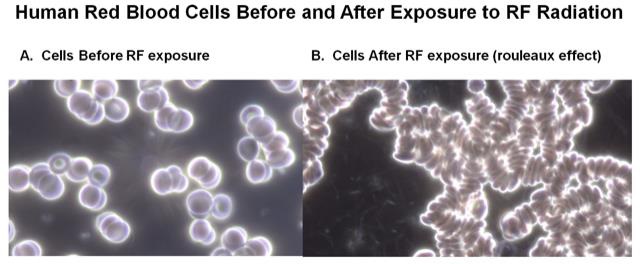
Figure 8. In A., red blood cells are not aggregated prior to RF radiation exposure. In B., blood cells from the same patient after 10 minutes of exposure to 2.45 GHz Wi-Fi aggregate and exhibit rouleaux effect.
4.8 Both Wireless Radiation and SARS-CoV-2 interfere with Calcium Channels in the Cell Membrane
Cell membranes are considered the major target for the interaction between mmW and biological systems, and the waves may alter structural and functional properties of membranes [72]. The cell membrane becomes more permeable from RF exposure from cell phones due to changes in the phospholipid composition at exposure levels well under the current FCC exposure limit. This increased cell membrane permeability altered the expression of 178 genes significantly (p < 0.05), affecting processes such as DNA replication and repair, cell signaling and calcium signaling, nervous system function, immune system response, lipid metabolism, and carcinogenesis [38]. Voltage gated calcium channels (VGCC’s) located in cell membranes control intracellular calcium ion (Ca2+) concentrations, and exposure to electromagnetic fields has been shown to increase intracellular Ca2+ concentration in human lymphocyte cells between approximately 25–50%, and this higher intracellular Ca2+ concentration in human lymphocyte cells increases allergic reactions [73]. Increasing intracellular Ca2+ concentrations have a myriad of health effects, from headaches to cancer in humans [66]. A related virus, porcine deltacoronavirus, attacks host cells by opening their voltage gated calcium channels (VGCCs) in the cell membrane, which increases the calcium ion (Ca2+) concentration inside host cells which increases virus replication. Reducing the intracellular calcium by blocking VGCC’s reduced the infection [74]. Anti-viral medications work by inhibiting VGCC activation to reduce intracellular Ca2+ to inhibit the viral replication [75]. 4.9 Both Wireless Radiation and SARS-CoV-2 interfere with Cell Signaling via p38/MAPK and mTOR Pathways SARS-CoV-2 takes over a human host cell by interfering with phosphorylation cell signaling and altering the phosphorylation of 40 human proteins and 49 kinase enzymes, involving the p38/MAPK and mTOR pathways among others. This takeover of the human host cells by the virus prevents the host cell from replicating and provides a stable environment for viral replication [76]. Signals from wireless communications have also been found to interfere with cell signaling and phosphorylation in the p38/MAPK and mTOR pathways, which were associated with an increased permeability in cell membranes due to changes in its phospholipid composition following exposure to radiofrequency radiation [38]. There have been many studies on the interaction of EMFs with cell signaling systems; interference with cell signaling and phosphorylation was reported in an earlier study that found that pulsed EMFs rapidly activates the mTOR signaling pathway [77].
For all the above reasons, environmental exposure to 5G mmW can increase cases and severity of COVID-19.
5. Conclusion
While 5G did not cause COVID-19, statistical analysis showed that exposure to 5G mmW (which is present in combination with 1G-4G and other RFR sources like Wi-Fi) is a statistically significant factor associated with higher COVID-19 case and death rates in the U.S. The higher population densities in the 5G mmW states or counties is another statistically significant factor but it does not entirely account for the higher case and death rates in those states and counties. Population density is an indicator not only of person to person contact, but also of wireless radiation exposure from neighbors. Latitude was also found to be a statistically significant factor that increases case and death rates for 5G mmW counties. Air quality was not found to be a statistically significant factor in the case and death rates except for California counties. The higher case and death rates in the average mmW state or county compared to that of the average non-mmW state or county were statistically significant for multiple dates (April 22, May 15, May 31 2020) and for a variety of measurements (deaths/million, deaths/test, cases/million, cases/test). Multiple linear regression found that at the state level, the mmW and the higher population density contributed almost equally to the increased case and death rates in the mmW states. Regression equations predicted that if the mmW states did not have mmW, the average cases per million for the mmW states would be reduced by 24%, and the deaths per million would be reduced by 30%. At the county level, the mmW exposure contributed three times as much as the higher population density to the increased case and death rates in the mmW counties. Regression equations predicted that if the mmW counties did not have mmW exposure, the cases per million for the mmW counties would be reduced by 39%, and the deaths per million would be reduced by 54%. For California counties, mmW and AQI were statistically significant contributors to the case and death rates while population density was not. Regression equations predicted that if the mmW counties did not have mmW, the cases per million would be reduced by 46%, and the deaths per million would be reduced by 57%. It is not difficult to see how radiofrequency radiation could increase the case and death rates when wireless radiation and SARS-CoV-2 share common mechanisms of harm to human and animal cells and wireless radiation exposure produces conditions that enhance susceptibility to SARS-CoV-2. Both interfere with cell signaling via the phosphorylation pathways, increase intracellular calcium ion concentrations by activating VGCC’s, and interfere with the actions of cell membranes. Radiofrequency radiation negatively impacts the immune system, reduces oxygen availability to blood cells and tissues, increases oxidative stress and inflammation, and reduces glutathione levels and vitamin D availability, all of which assist viral infection. In this analysis, we compared 5G mmW areas with those that have RFR but do not yet have activated mmW technology. This is like comparing smokers to those exposed to second-hand smoke. Consequently, the difference between COVID-19 attributed case and death rates may be much higher had we compared areas with 5G mmW technology to areas with little or no RFR exposure, which is nearly impossible to do as few of these areas remain in the U.S. The rollout of mmW 5G has been done without any testing to assess its safety, either singly or in combination with RF frequencies already present, such as 1G-4G and Wi-Fi. In fact, no long-term safety testing was done on any wireless technology before they were introduced to the market. Government presumption of safety on all wireless technology is that harmful effects can only happen at thermal levels and that effects at non-thermal levels do not exist, i.e. so as long as wireless devices and infrastructure do not emit enough energy to heat tissues, then there is nothing to be concerned about. However, thousands of studies have shown harmful biological effects at non-thermal levels, and medical devices using non-thermal levels of radiofrequency radiation have been used therapeutically for decades, which is concrete evidence of beneficial and adverse biological effects at non-thermal levels of non-ionizing radiation. Currently, mmW have been deployed for 5G in approximately 50 U.S. cities, but when 5G is fully rolled out, mmW will be everywhere. More than 400 scientists and doctors have signed the 5G Appeal [78] requesting a moratorium on the 5G rollout. Any economic benefits from 5G are likely to be outweighed by the risk of harm to the health of billions of people around the world.
Acknowledgments
We thank the anonymous reviewers and those dedicated scientists and doctors who have published their findings regarding either COVID-19 or RFR
**Funding
**No funding received for this research.
**Competing Interests
**None
Article Details
How to Cite
TSIANG, Angela;
HAVAS, Magda.
COVID-19 Attributed Cases and Deaths are Statistically Higher in States and Counties with 5th Generation Millimeter Wave Wireless Telecommunications in the United States.. Medical Research Archives, [S.l.], v. 9, n. 4, apr. 2021. ISSN 2375-1924. Available at: https://esmed.org/MRA/mra/article/view/2371. Date accessed: 30 june 2021. doi: https://doi.org/10.18103/mra.v9i4.2371.
ABNT
EndNote – EndNote format (Macintosh & Windows)
ProCite – RIS format (Macintosh & Windows)
Reference Manager – RIS format (Windows only)
The Medical Research Archives grants authors the right to publish and reproduce the unrevised contribution in whole or in part at any time and in any form for any scholarly non-commercial purpose with the condition that all publications of the contribution include a full citation to the journal as published by the Medical Research Archives.
References
