
Adapted from an article by Bruce Kushnick June 17, 2021 | Original Medium article here.
The 2020 Verizon-NY Annual Report details billions that can be used to close the Digital Divide in the state of New York — offering lessons that can be applied to every other state. Solutions without any government subsidies. . .
What Is the Verizon-NY 2020 Annual Report?
On May 28th, 2021, the Verizon-NY 2020 Annual Report was published. Verizon-NY is the primary state public telecommunications utility (SPTU) and New York is the only state we know of that requires and makes public a financial annual report for the SPTU.
This is not the Verizon Communications Inc. Annual Report, which is for the entire holding company. Verizon-NY is just one of Verizon’s many East Coast public telecommunications utilities: that means there are Verizon SPTUS ranging from Massachusetts to Virginia. The FCC aided and abetted this scheme because it stopped publishing SPTU information in 2007, covering the tracks for massive cross subisides that flowed from SPTUS to other subsidiaries owned by the Telecom Holding Companies.
DOWNLOAD the Verizon-NY 2020 Annual Report and the IRREGULATORS Analysism, explaining how to read the report.
The Accounting Used by Verizon Evidences Manipulation
The Verizon NY report relies on the FCC’s accounting rules, known as “USOA”, “Uniform System of Accounting”, and over the last decade we uncovered that they have been manipulated so that by 2020, the majority of all expenses for Verizon’s services using the state infrastructure are mainly charged to one category; the wireline, local phone service (“intrastate”) — while the other services using the networks are getting a free ride.
The Data Show $Billions Per Year in Overcharging and Cross-Subsidies
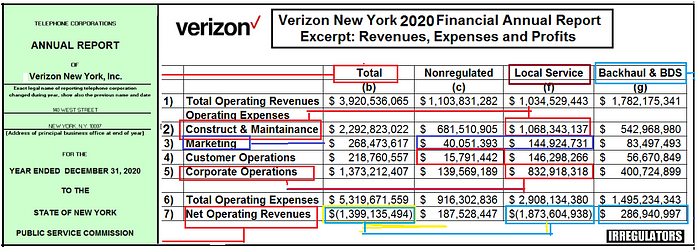
Right on the graphic above, anyone can see see billions of dollars of expenses, including Verizon’s “Corporate Operations” expenses, which includes everything from the corporate jets, executive pay and the lobbyists and lawyers — all are mainly being charged to the local basic phone service subscribers.
Note: See our previous analysis of Verizon NY Corporate Operations, which makes clear that billions of dollars of the SPTU construction budget were charged to the Local Service.
These accounting moves caused the Digital Divide. The Telecoms falsely claimed that fiber is or too expensive and the SPTU was unprofitable, which was a manufactured excuse to justify rate increases. This financial report shreds that argument.
- How Much are We Talking About? The scale of how much money has been manipulated, for just one year, in just New York, is mindboggling —
How is it possible that Local Service paid over 60% of Corporate Operations, $833 million, on revenues of only $1 billion? How can Local Service pay $1.1 billion in ‘Construction & Maintenance’, (sometimes called “Plant” and “Non-Specific Plant”) yet it spent only an estimated $75-$100 million for maintaining and upgrading the copper networks. Where did the $1 billion in capex go?
We estimate that out of these excessive charges, while a small amount would be considered legitimate and tied to Local Service, almost $2 billion dollars was overcharged, which is only a partial accounting.
- Verizon NY Local Service was overcharged an estimated $925 million in corporate operations and marketing expenses, in just New York, in just 2020
- Verizon NY Local Service was overcharged an estimated $1.02 billion due to the construction and maintenance expenses put into Local Service budget.
The ‘Free Ride’ of the Other Lines of Business. Verizon NY has two other lines of business on the books;
- “Nonregulated”, (which includes VOIP and FiOS video), and
- “Business Data Services”, data lines (sometimes called “backhaul” or “special access”), used for wireless or businesses —
Both are getting a free ride since they don’t pay at the same rate as competing providers are charged to access the network, nor the ‘fair share’ of the total as compared to Local Service. “Nonregulated” Service revenues were $1.1 billion but paid a fraction of all costs. Compared to than Nonregulated services, Local Service paid
- 263% more in Marketing expenses,
- 497% more in Corporate Operations expense
- 217% more in overall expenses —
The States Can Fix These Problems
This analysis is damning and a blueprint for solutions — after states recover this misappropriated money.
- This Is Verizon NY’s Data: Not Ours: The financials that detail this massive cross-subsidy scheme comes from Verizon NY’s own annual report, filed with the NY Public Service Commission. (NOTE: We did not generate these financial reports, but for presentation purposes, we streamlined some of the entries and added their ‘common names’. For example, “Backhaul” is called “Other” in the annual report.)
- Every State has a State Public Telecom Utility, and as far as we can tell, every state is still relying on these corrupt accounting formulas.
- State Public Telecom Utilities provide the Copper as well as Fiber Optic Wires. The state infrastructure includes both the existing copper ‘legacy’ networks as well as the fiber lines. Verizon’s fiber to the home (premises), ‘FTTP’, networks were created as part of the existing telecommunications public utility.
- America Was Supposed to be a Fiber Optic Nation by 2010, State by State. Announced as the “National Infrastructure Initiative”, and commonly known as the “Information Superhighway”, the Clinton-Gore campaign in 1991 announced a plan to have America’s state utilities’ copper wires be replaced with fiber optic wires, completed by 2010. By the end of 2014, we estimated that $400 billion had been overcharged, as increases on customers’ bills or tax perks. Though it varies by state, most of the networks were never built by what are now AT&T, Verizon and Centurylink — By 2021, it is well over $½ trillion dollars in customer overcharging.
- How Do We Prove that Local Service Was Charged the Majority of Shared Infrastructure Construction? The information pertaining to the investments in the networks shows that 73% of ‘work in progress’, was put into Local Service in 2020, and overall, over 60% of the total for Verizon NY was charged to the service. But, these funds DID NOT upgrade the basic, copper-based phone service.
- How Do We Know Verizon Wireless Never Paid Market Prices to Use the Networks or for the Construction? The ‘affiliate transactions’, information (where other subsidiaries pay Verizon NY for some service — or it pays another Verizon subsidiary), shows no payments that would cover the estimated $1 billion or more in repayments for the construction or use of the networks.
- DO THE MATH: Nationwide Overcharging. Though it varies by year and by state, for these basic financial items — overcharging via Corporate Operations expenses and the diversion of the construction budgets, nationwide, we estimate that it is over $20 billion in annual overcharging. See the state-by state estimates, and the estimated national overcharging caused by Big Telecom & Cable in America in 2021.
No More Government Subsidies for Telecom . . .
Get the Money Back to Close the Digital Divide
Isn’t it time for our elected officials and the state and federal regulators, including the FCC, to do their job? With plans being discussed by Congress that would pay out $40 billion, $65 or $100 billion to fix the Big Telecom-Cable-caused-‘Digital Divide’, not to mention the state broadband plans, (with some of these plans being just another gift of taxpayer funds to Big Tel), shouldn’t we finally go after the cooked corporate books and instead use the money to serve the towns, cities, counties and states with wireline fiber optics to ALL citizens are reasonable rates?